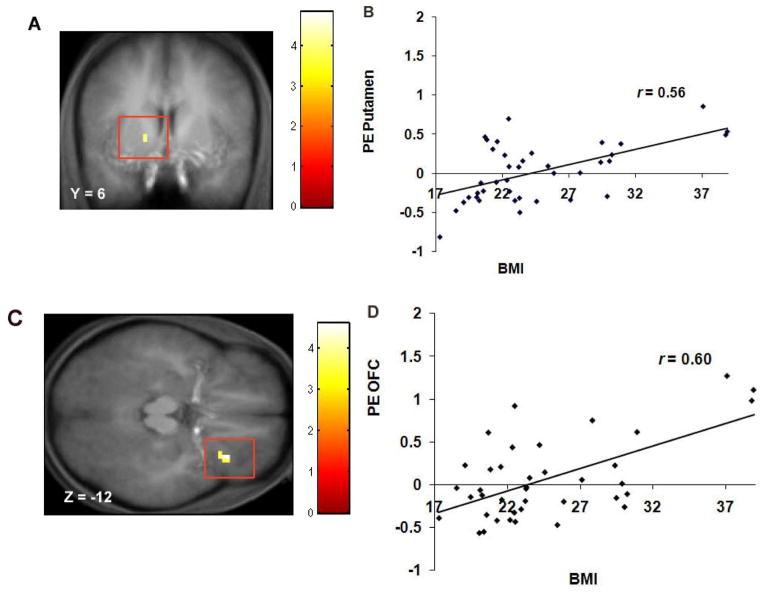
Figure 1.
A. Coronal section of increased activation in a region of the putamen (−15, 6, 3, Z = 3.59, P < 0.05 FDR corrected) during appetizing food - unappetizing food as a function of BMI with B. the graph of parameter estimates (PE) from that region. C. Axial section of increased activation in the lateral OFC (33, 27, −12, Z = 4.01, P < 0.05 FDR corrected) during appetizing food – water as a function of BMI with D. the graph of PE from that region.

