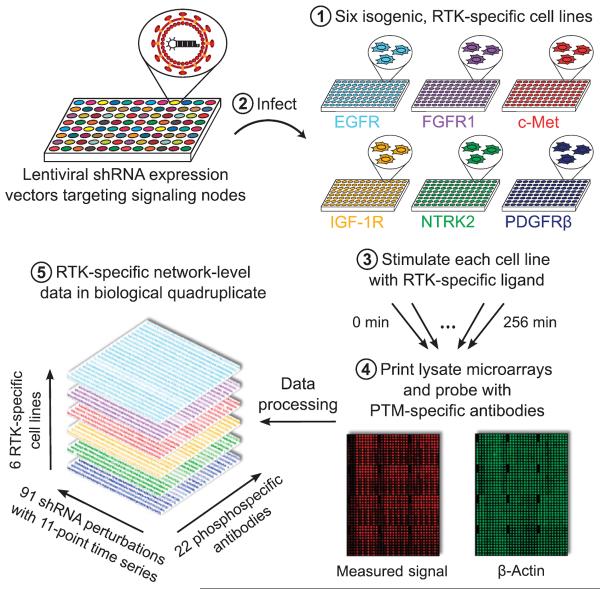
Fig. 1. Schematic of perturbation-based profiling for analysis of RTK-specific signaling networks.
Six isogenic cell lines expressing EGFR, FGFR1, c-Met, IGF-1R, NTRK2, or PDGFRβ were treated with lentiviral shRNA expression vectors to modulate the abundance of 38 downstream signaling proteins. Upon stimulation with RTK-specific ligands, time-dependent signaling events were monitored by probing for changes in the phosphorylation [post-translational modification (PTM)] of specific sites in downstream proteins using high-throughput lysate microarrays. The resulting compendium of signaling measurements, constituting more than half a million individual data points, served as a starting point for network inference.

