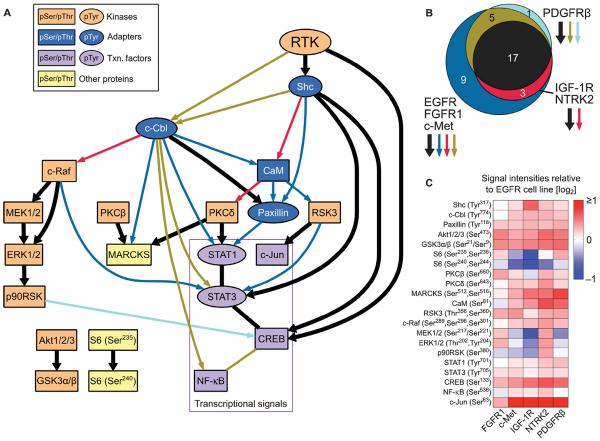
Fig. 4. A consensus model for the six RTKs reveals a core signaling backbone and RTK class-specific interactions.
(A) RTK backbone edges (relationships) are shown in thick black lines, whereas class-specific relationships are colored and correspond to (B). Nodes are colored according to their approximate biological function, and tyrosine- and serine/threonine-containing phosphorylation epitopes are shown as ovals and boxes, respectively (noted in insert; Txn, transcription). (B) Venn diagram showing shared and class-specific edges across the three RTK classes. All IGF-1R/NTRK2 edges and all but one of the PDGFRβ edges are present in the EGFR/FGFR1/c-Met network. (C) Median signal values (across all time points, shRNA conditions, and biological replicates) for each phosphosite in each cell line relative to the EGFR cell line.

