
Fig. 5. RTK and ligand expression in CCLE cell lines.
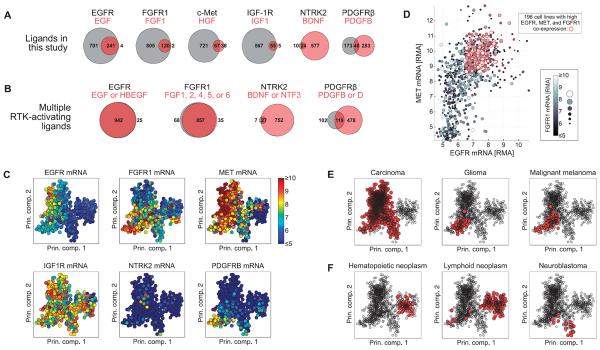
(A) Number of cell lines expressing a given receptor but no ligand (value displayed inside or to left of gray circle), a given ligand but no receptor (value displayed inside or to right of light red circle), or coexpressing receptor and ligand (value displayed inside dark red overlapping region) across 967 cell lines in the CCLE. (B) Including additional cognate ligands increases the number of cell lines in the CCLE that coexpress receptor and at least one ligand. (C) Gene expression values of the six RTKs displayed in principal component (Prin. comp.) space. Each circle represents a cell line, and the color represents the abundance of the indicated mRNA. (D) mRNA abundance expressed as RMA for EGFR (x axis), MET (y axis), and FGFR1 (gray scale) plotted against one another. Red circles indicate cell lines with greater than median expression of each of the three RTKs. (E and F) Tumor histologies enriched (E) or depleted (F) for coexpression of EGFR, FGFR1, and MET. Red markers indicate cell lines derived from the indicated tumor histology type. Significance of enrichment or depletion by hypergeometric test: P = 8.7 × 10⁻²⁶, P = 3.0 × 10⁻⁶, P = 1.9 × 10⁻³ for carcinoma, glioma, and melanoma, respectively (E); P = 2.0 × 10⁻³⁰, P = 1.7 × 10⁻²⁴, and P = 7.8 × 10⁻³ for hematopoietic neoplasm, lymphoid neoplasm, and neuroblastoma, respectively (F). The PCA results plotted in (C), (E), and (F) represent the first two components of the PCA coefficients, or loadings.