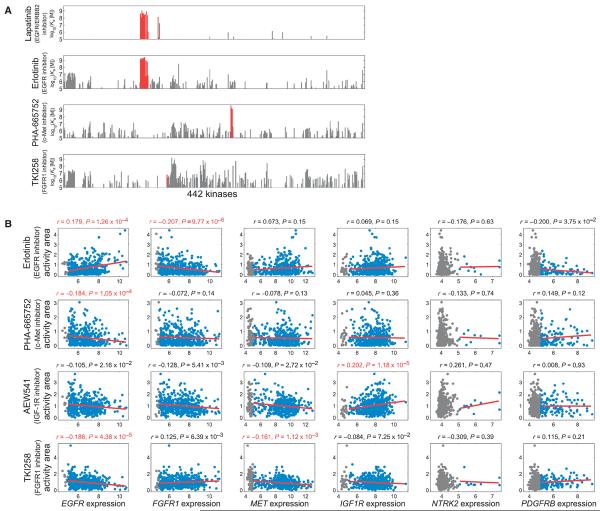
Fig. 6. RTK expression correlates with decreased sensitivity to same-class RTK-directed drugs.
(A) Affinity and specificity of kinase inhibitors lapatinib, erlotinib, PHA-665752, and TKI258 for 442 kinases [data from (28)]. On-target effects are shown in red. (B) Correlating RTK gene expression with responses to EGFR, FGFR1, c-Met, and IGF-1R inhibitors across hun dreds of cancer cell lines. Cell lines with RMA expression values >5 or <5 are shown in blue or gray, respectively. Red lines indicate linear fits to the data. Values above subplots are Spearman correlation coefficients and P values, shown in red for genes that significantly correlated (1% FDR) with drug response.

