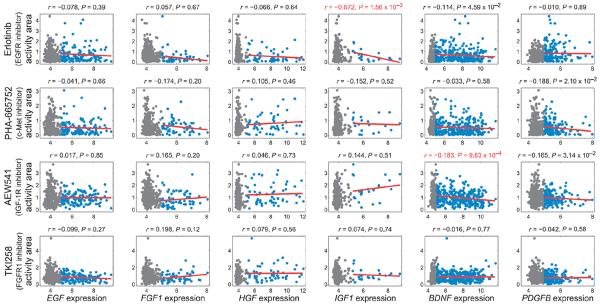
Fig. 7. Relationships between ligand gene expression and response to RTK-directed drugs.

Correlations between ligand gene expression and responses to EGFR, FGFR1, c-Met, or IGF-1R inhibitors were determined across hundreds of cancer cell lines. Cell lines with RMA expression values >5 or <5 are shown in blue or gray, respectively. Red lines indicate linear fits to the data. Values above subplots are Spearman correlation coefficients and P values, shown in red for genes that significantly correlated (1% FDR) with drug response.
