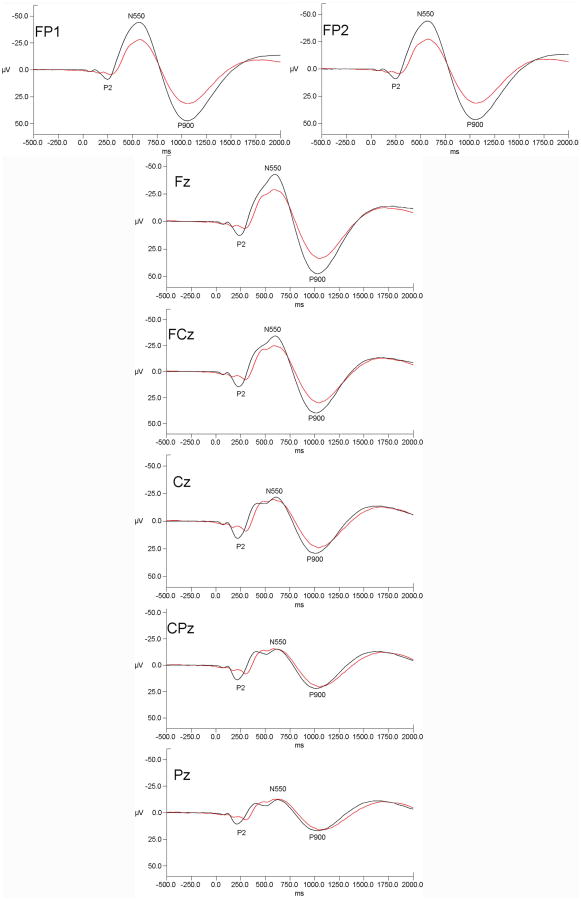
Figure 1.
Grand mean evoked potential waveforms for alcoholics (red lines) and controls (black lines) for the seven measured electrode sites. Data are presented with negative voltages up the Y axis. The pattern of results indicates that alcoholic-control differences were prominent over frontal and frontal-polar sites but were diminished at more posterior scalp locations.

