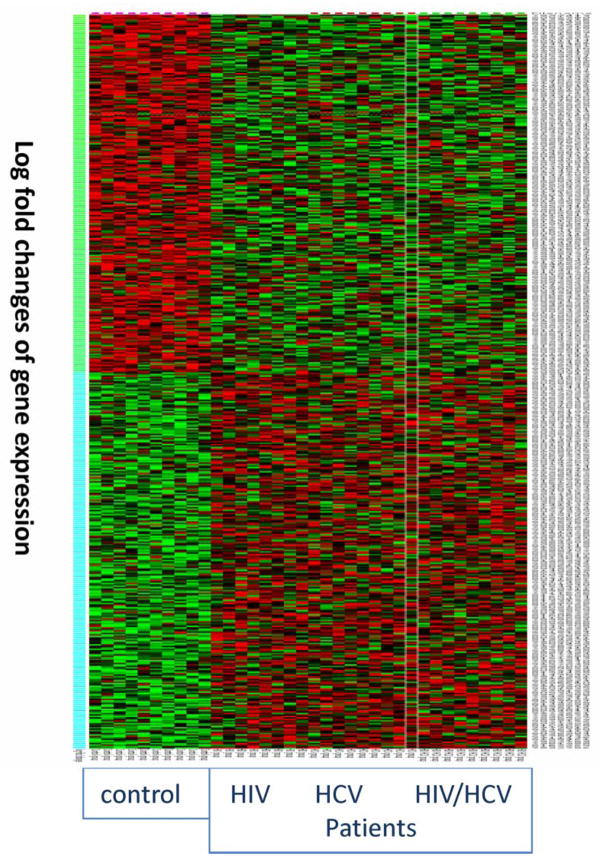
Figure 1.
Heat map of gene array data of colon biopsies from control, HIV, HCV and HIV/HCV-coinfected patients. Log-fold changes of gene expressions (Y axis) for the colon tissues from control, HIV, HCV and HIV/HCV-coinfected patients are plotted in a heat map graph. Red represents up-regulated gene expression, while green represents down-regulated gene expression. Degree of colour reflects the levels of changes.

