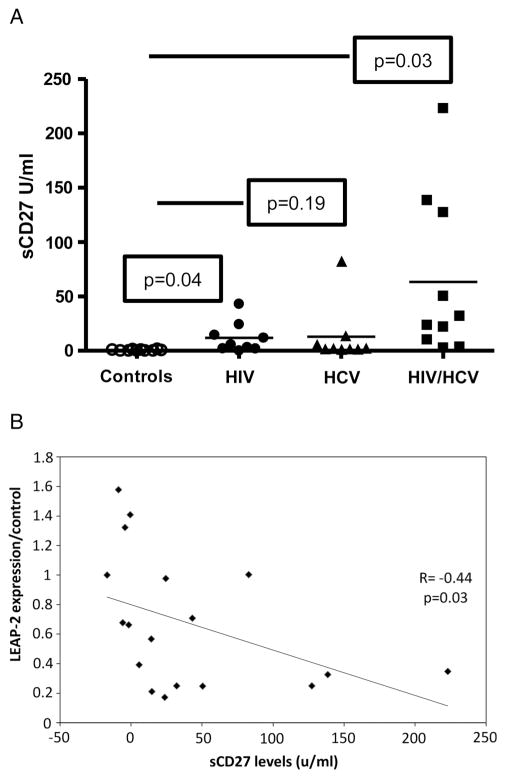
Figure 4.
Levels of sCD27 in the plasma of enrolled subjects. (A) Plasma levels of sCD27 were measured by ELISA as described in methods. Data are presented using vertical scatterplot graph. The horizontal lines represent the mean values with each symbol represents one subject; controls (open circle), HIV-monoinfected (filled circle), HCV-monoinfected (filled triangle), and HIV/HCV-coinfected (filled rectangle) patients. The levels of sCD27 in the control were significantly lower than the levels in HIV-monoinfected (p=0.04), and HIV/HCV-coinfected patients (p=0.03) (mean±SD: 0.5±0.2, 11.9±4.7 and 63.4±23.5 U/mL, respectively), but not significantly different from the level of sCD27 in the HCV-monoinfected patients (p=0.19, mean±SD: 12.9±8.8 U/mL). (B) A significant negative correlation (p=0.03 r= −0.44) between plasma sCD27 levels of the patients with their relative expression of liver expressed antimicrobial peptide-2 in colon tissue compared with controls. The data was evaluated using Spearman’s correlation coefficient.

