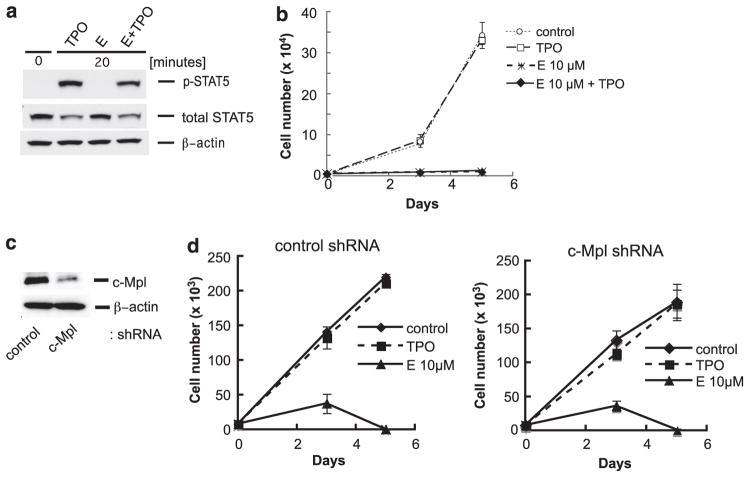
Figure 2.
(a) Western blot analyses to detect p-STAT5 in Mo7e cells. After 24 h starvation of serum and cytokines, Mo7e cells were stimulated with E (10 μM) alone, rhTPO (100 ng/ml) alone or with combination of E and rhTPO for 20 min. Western blot was performed as described in Figure 1 using the following antibodies; anti-phosphorylated STAT5 (Tyr694) antibody and anti-STAT5 antibody (nos 9356 and 9363, respectively, Cell Signaling). (b) Cell growth analyses (drug competition assay) of Mo7e cells after treatment of E (5 μM or 10 μM) alone, rhTPO (200 ng/ml) alone, or combination of E and rhTPO. Cell culture conditions, methods, and analyses were performed as described in Figure 1. Data are shown as the mean±s.d. Experiment was repeated at least three times with consistent results. (c) Western blot of c-Mpl protein expression in Mo7e cells without and with the c-Mpl knockdown. The targeted sequence was selected from the previous report15 and shRNA constructs were designed with two base modifications in the sense strand. The c-Mpl small interfering RNA (siRNA) targeting sequence and control siRNA sequence were as follows: c-Mpl: 5′-gcacctctgggtgaagaatgt-3′, control: 5′-ctttatacgtagtcataag-3′. The shRNA constructs were cloned into the HIUG lentiviral vector, which was kindly provided by Dr EJ. Brown in the University of Pennsylvania, and the lentivirus clones were stably transduced into Mo7e cells. The western blot was performed as described in Figure 1, and protein–antibody signals detected were quantified using ImageQuant TL software (GE Healthcare, Piscataway, NJ, USA). (d) Cell growth analyses in Mo7e cells without and with the c-Mpl knockdown. Knockingdown of c-Mpl did not change E’s inhibitory effect. The manipulated control- and c-Mpl knocked-down Mo7e were cultured in the same conditions as described in Figure 1. After treatment with rhTPO (200 ng/ml) or E (10 μM), the number of viable cells in triplicate wells were counted on days 3 and 5. Cell growth assay data are shown as the mean±s.d.

