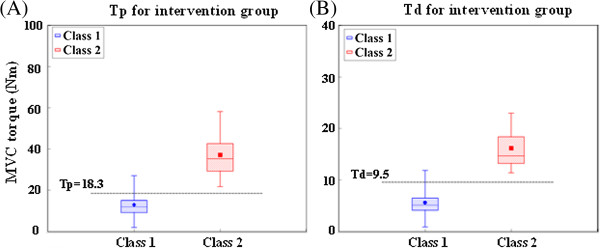
Figure 3.

Relationship between plantarflexion (Tp, panel A) torque and dorsiflexion (Td, panel B) MVC torque and subject class membership, for the 10MWT evaluation in the Lokomat group. Note: in each boxplot, the bounds of the box denote the first and third quartiles, while the two whiskers denote the minimum and maximum values.
