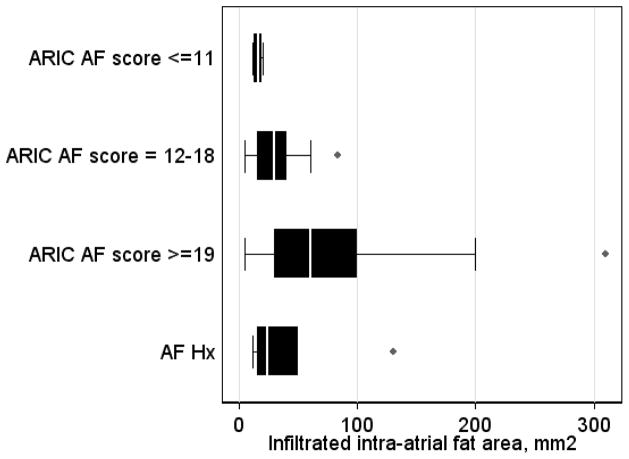
Figure 2.
Box-plot of infiltrated intraatrial fat area in groups of patients at AF risk and patients with paroxysmal AF. Median (white vertical line crossing the box) and interquartile range [IQR] (box). Whiskers specify the adjacent values, defined as the most extreme values within 1.5 IQR of the nearer quartile.

