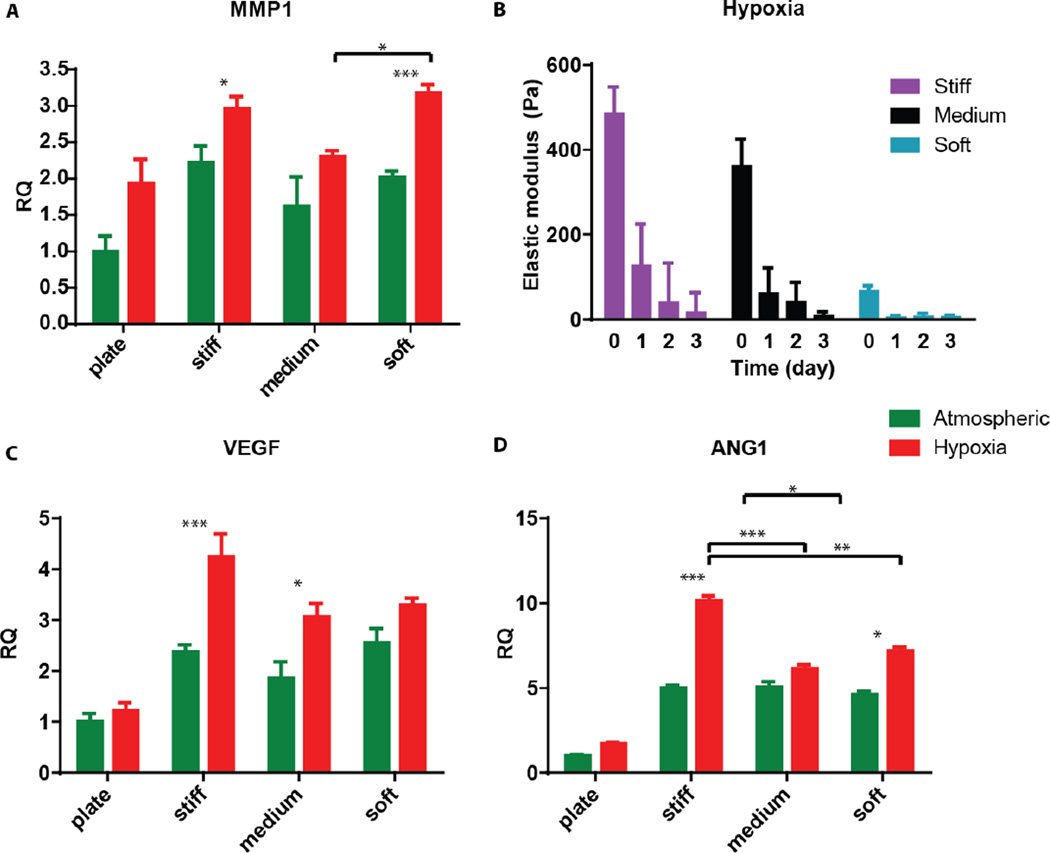
Figure 6. Angiogenic gene expression.
(A) Quantitative RT-PCR for the expression of MMP-1 in HT1080 cells cultured in Petri dishes (plates) or encapsulated in the different hydrogels for 24 hours. (B) Viscoelasticity measurements of the different construct types along the three-day hypoxic culture period. (D-C) Quantitative RT-PCR for the expression of VEGF, and ANG-1 in HT1080 cells cultured in Petri dishes (plates) or encapsulated in the different hydrogels for 24 hours. Significance levels (n=3) were set at: *p<0.05, **p<0.01, and ***p<0.001.

