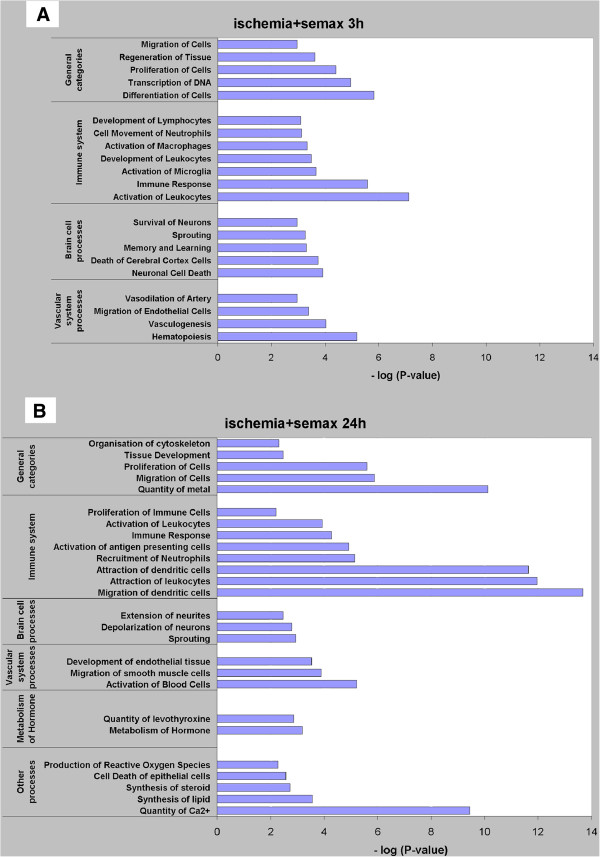
Figure 3.
Biological processes based on the genes that exhibited alteration in their expression levels under Semax treatment. The x-axis is the absolute value of the log transformed P-value, which means that a smaller P-value has a larger positive value on the x-axis. Significance was determined using Fisher’s exact test (P-value < 0.01). A value of 2 on the x-axis is equivalent to a P-value of 0.01. The y-axis shows the categories of biological processes that were related to lists of genes that exhibited changed expression in the experimental conditions. A. Data obtained 3 h after pMCAO for the ischemic rat cortex under Semax treatment; B. Data obtained 24 h after pMCAO for the ischemic rat cortex under Semax treatment.

