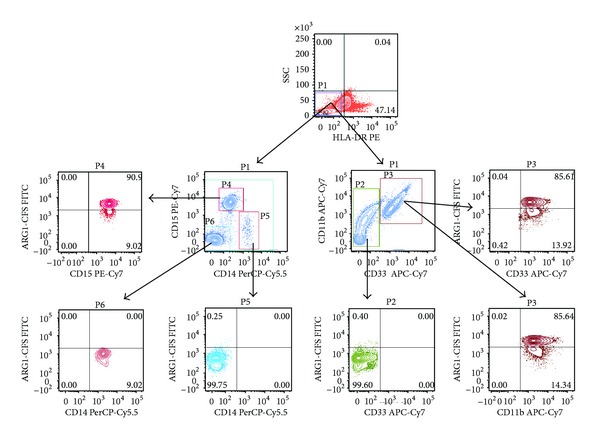
Figure 2.

Arginase 1 expression in different subsets of circulating MDSC in patients with PC. Flow cytometric evaluation of ARG1 expression in CD33, CD11b, CD15 and CD14 in whole blood is shown in the representative dot plots. Gates were set based on negative controls. Numbers represent the percentages from the original populations gated. P (number) above each FACS plot indicates the population gated which was analysed. The gate was first set on HLA-DR negative against side scatter as shown in the top dot plot. Next, the CD11b+ & CD33+ (right) and CD14+ & CD15+ (left) subsets were identified. The expression of ARG1 in each subset was then determined as shown in the bottom dot plots.
