
Figure 1.
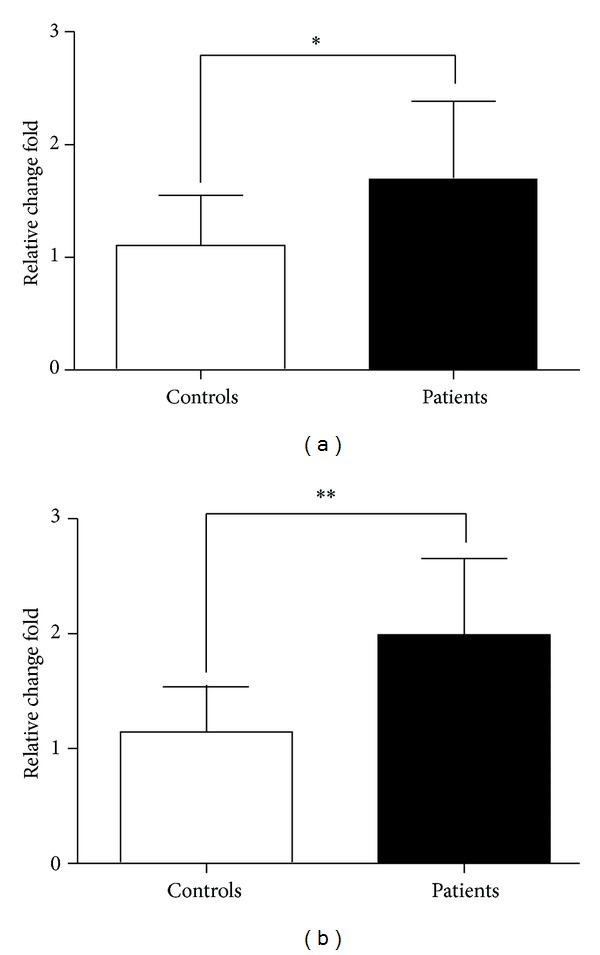
The levels of RORα and GATA3 mRNA in PBMC. qRT-PCR analysis of RORα (a) and GATA3 (b) mRNA levels in PBMC from gastric cancer patients and healthy controls. Data shown are represented as mean ± SD (all samples were measured in triplicate). *P < 0.05 and **P < 0.01.