
Figure 4.
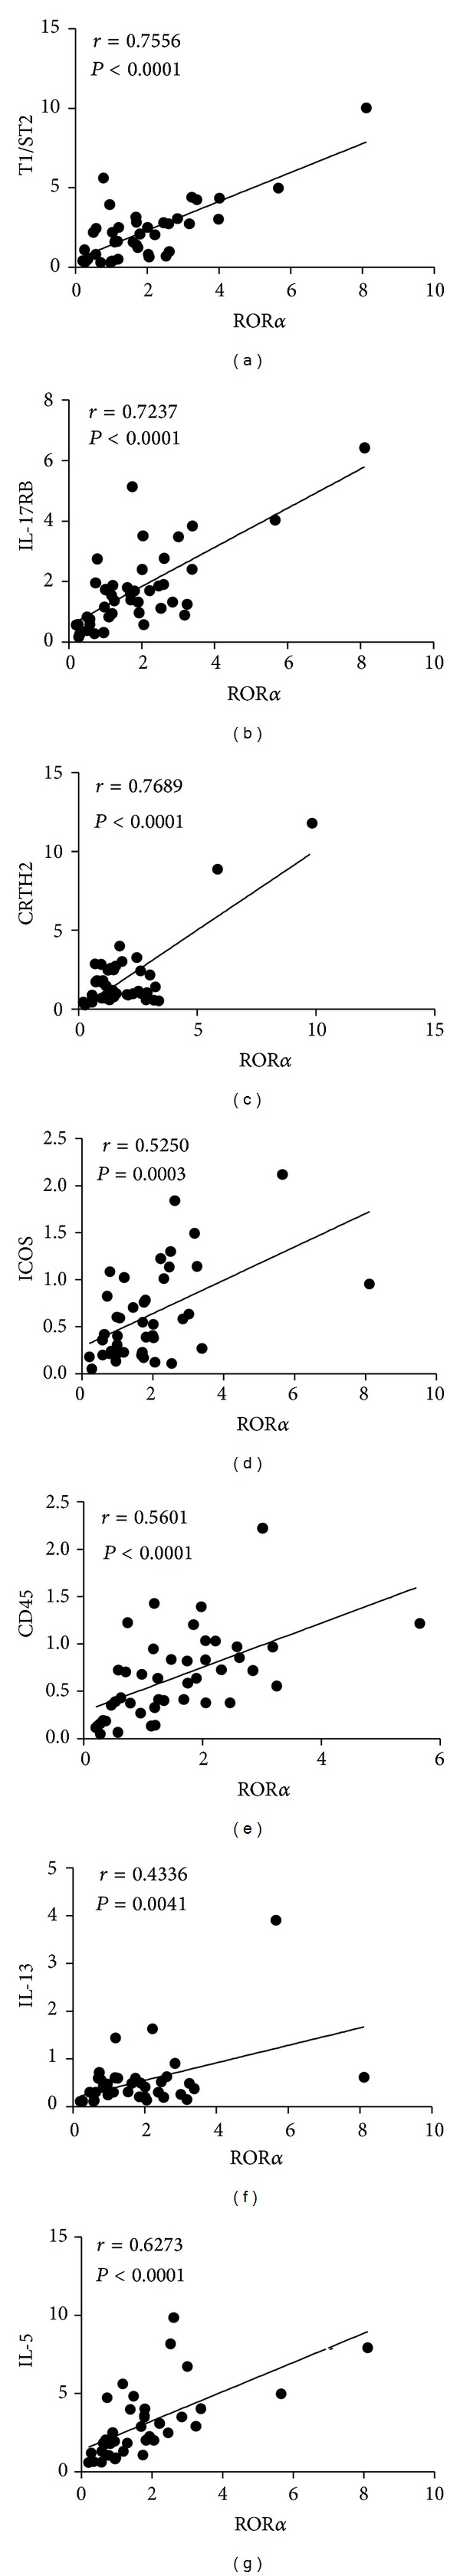
Correlation between the transcription factor RORα and related genes mRNA levels. (a) The correlation of RORα and T1/ST2 mRNA expression (r = 0.7556, P < 0.0001), (b) RORα and IL-17RB (r = 0.7237, P < 0.0001), (c) RORα and CRTH2 (r = 0.7689, P < 0.0001), (d) RORα and ICOS (r = 0.5250, P = 0.0003), (e) RORα and CD45 (r = 0.5601, P < 0.0001), (f) RORα and IL-13 (r = 0.4336, P = 0.0041), and (g) RORα and IL-5 (r = 0.6273, P < 0.0001) in gastric carcinoma patients. There were positive correlations between them.