
Figure 6.
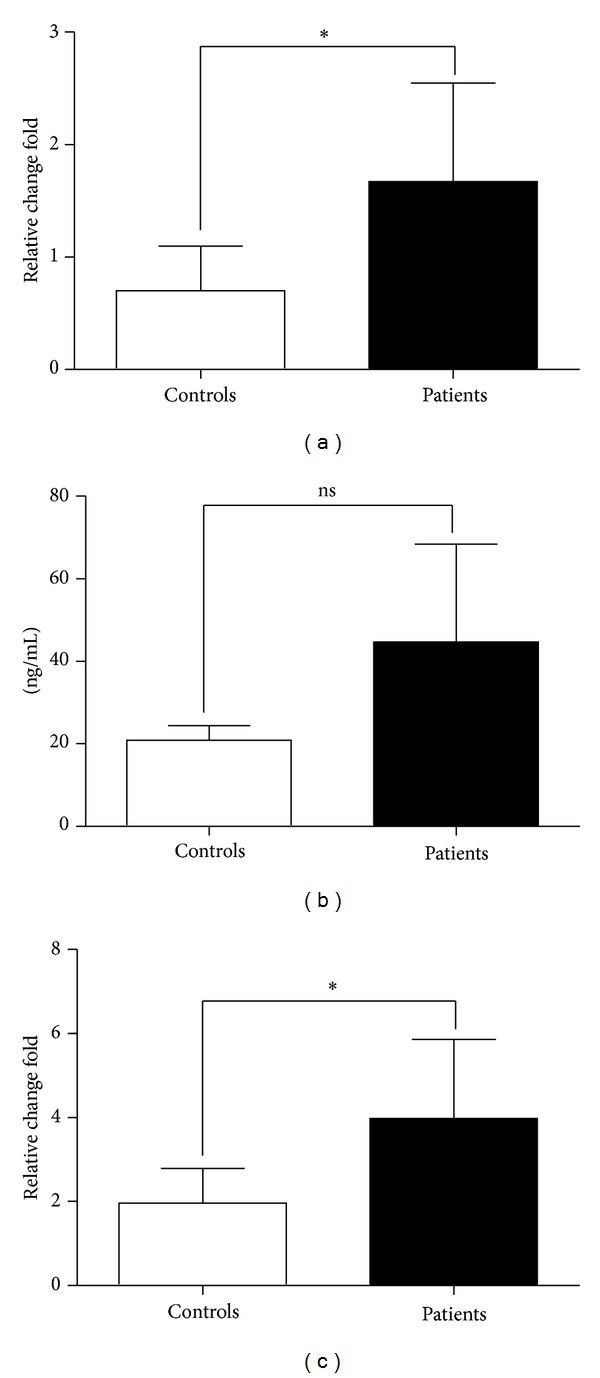
Increased expression levels of Arg1 and iNOS in gastric cancer patients. qRT-PCR analysis of Arg1 (a) and iNOS (c) mRNA levels in PBMC from gastric cancer patients and healthy controls and ELISA analysis of Arg1 protein levels (b) in plasma. Data shown were represented as mean ± SD (all samples were measured in triplicate). *P < 0.05; ns means no significance.