
Figure 7.
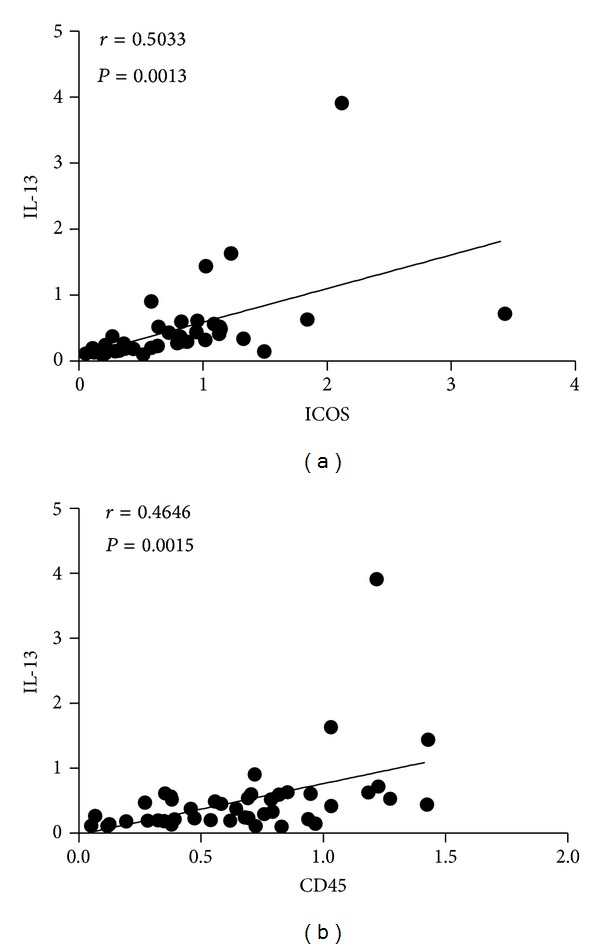
Correlation analysis between IL-13 and ICOS and CD45 mRNA levels. (a) The correlation of IL-13 and ICOS mRNA expression (r = 0.5033, P = 0.0013) and (b) IL-13 and CD45 mRNA expression (r = 0.4646, P = 0.0015) in gastric cancer patients; there was a positive correlation between them, respectively.