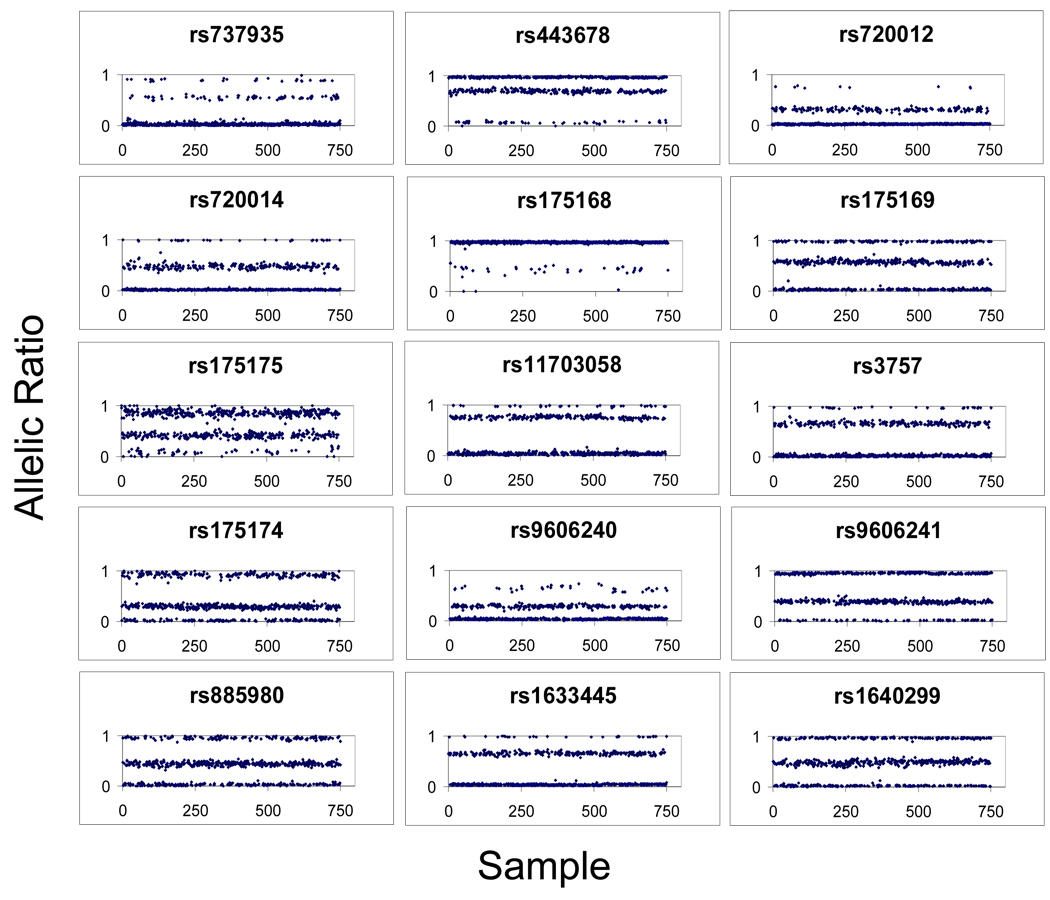
Figure 2. Genotype clusters for 15-plex assay.
Individual figures represent the allelic ratios (X axis) produced from a first pass genotyping of 750 human genomic DNA samples (Y axis). Variability in allelic ratios is observed for different SNP assays, generally with skewing of heterozyote clusters, though homozygote clusters can also be skewed (i.e. rs9606240). Nonetheless, for each SNP genotype clusters are robust (see Table 4 for silhouette scores).

