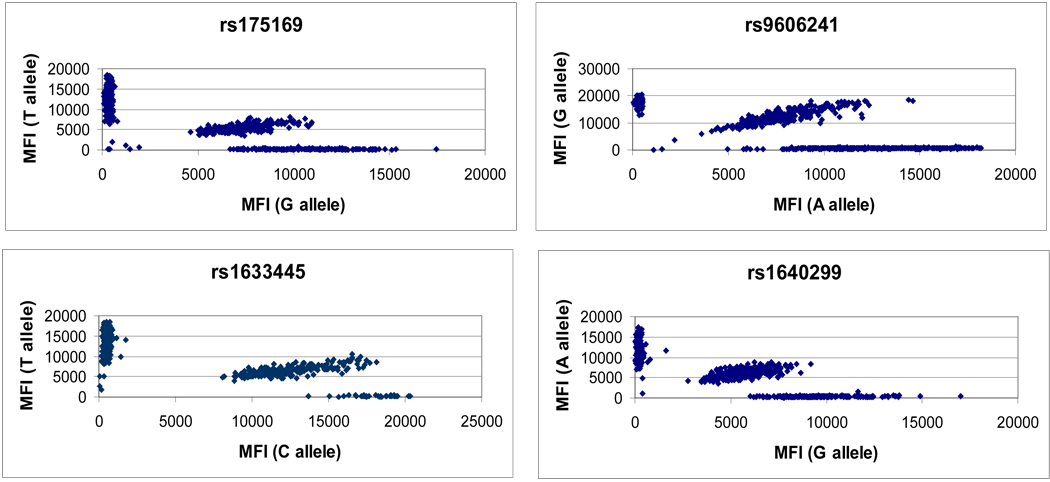
Figure 3. Raw data of 4 representative SNP assays.
Each scatterplot represents the median fluorescence intensity (MFI) of allele 1 and allele 2 for four SNPs. The scatterplots represent the raw data from which allelic ratios (figure 2) were calculated.

