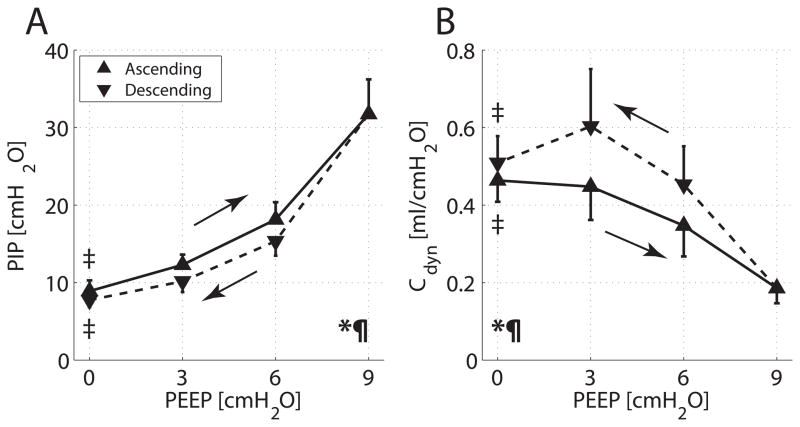
Fig. 2.
Group averages and SD for (A) peak inspiratory pressure (PIP) versus positive end-expiratory pressure (PEEP) and (B) dynamic compliance (Cdyn) versus PEEP. Values obtained during ascending and descending PEEP ramps are displayed with solid and dashed lines, respectively. Two-way ANOVA for changing PEEP: *P < 0.001; for type of ramp (ascending vs. descending): P < 0.001. Paired t test for PEEP 0 versus 9 cm H2O: ‡P < 0.001. The area under the curve subtended by PIP was larger in the ascending than in the descending PEEP ramp (P < 0.001); the area under the curve subtended by Cdyn was larger with descending PEEP (P < 0.001).

