
Figure 5. Scaling behavior of adaptation dynamics and of kinase activity.

(A) FRET measurements of kinase activity upon sudden addition of attractant,  M
M  -DL-methylaspartate, at
  s. Expression of CheY-YFP/CheZ-CFP FRET pair was induced by
  M IPTG. The FRET signal was recorded every second and smoothened by sliding window of four seconds. CheB was expressed from plasmid at varying levels (0% to 0.01%) of arabinose yielding
  -fold (black line),
  -fold (dark brown line),
  -fold (light brown line), and
  -fold (gray line) the native expression level. Bold solid lines are the predictions of the mathematical model, Eq. (13), with adaptation rate
 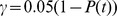 . (B) Adaptation dynamics from (A) after rescaling of the kinase activity with the CheB expression level. (C) FRET measurements of kinase activity (brown line) and corresponding theoretical prediction (black line) for a sequence of increasing steps (1
 M, 3
M, 3 M, 10
M, 10 M, and 30
 M) of
M) of  -DL-methylaspartate. (D) Linear relationship between CheB expression level and adapted kinase activity. (E) Linear relationship between CheR expression level and the adaptation rate. (F) Linear dependency of kinase activity on concerted changes in CheY-YFP/CheZ-CFP expression level. Lines in the panels (D–F) show least-squares fits to the data and error bars denote standard errors.