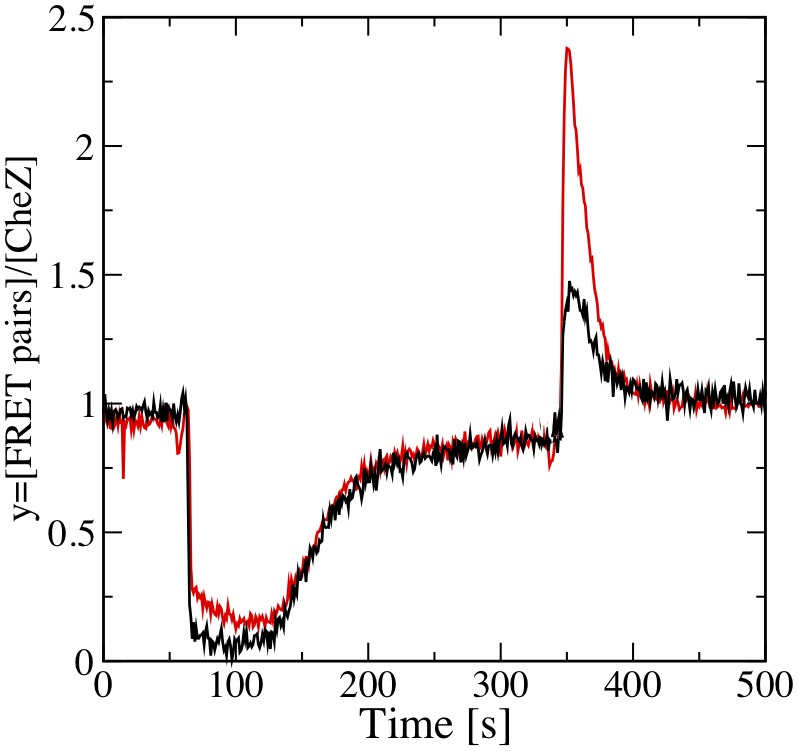
Figure 6. Experimental confirmation of dynamically invariant response behavior of the chemotaxis pathway in E. coli upon a perturbation indicated by  in Fig. 4.

Shown are the effects of a decreasing ratio between the concentrations of CheY-YFP and CheZ-CFP and the remaining signaling proteins by 2-fold (red line) and  -fold (black line), whereby CheY-YFP/CheZ-CFP were expressed in LL4 cells at
  or
or  M IPTG induction, respectively. Cells were stimulated by addition and subsequent removal of
  M MeAsp. The y-axis shows the normalized change in FRET signal, which is to good approximation proportional to the signaling output,
  , as explained in the main text. The base line of zero activity was determined by addition of saturating amounts of attractant.
