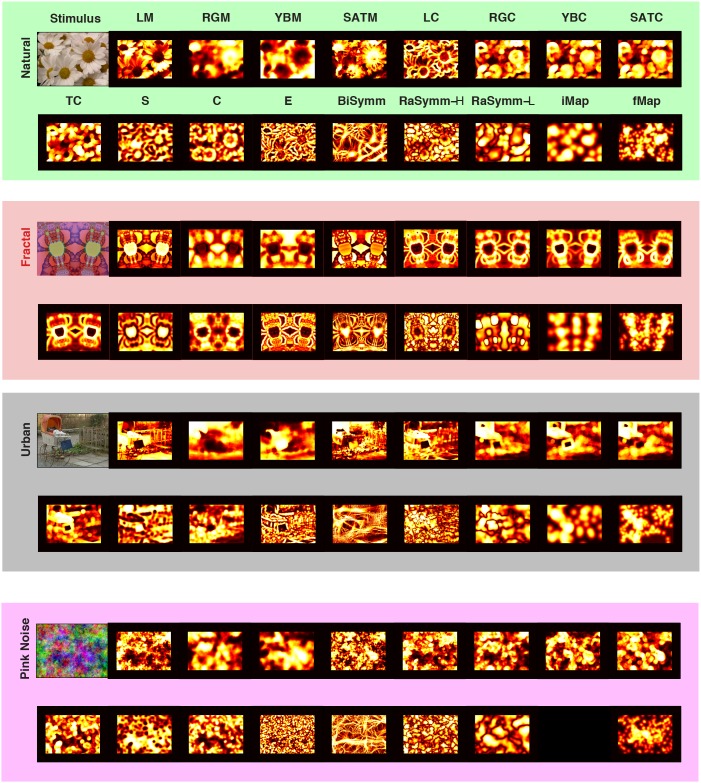
Figure 1. Decomposition of stimuli into a set of low- and high-level features.
For each category (first row, green background, Natural; second row, red background, Fractal; third row, black background, Urban; last row, magenta background; Pink Noise) a representative stimulus (left upper corner) and its associated low-level feature maps are shown. LM: Mean Luminance; RGM: Mean Red-Green Intensity; YBM: Mean Yellow-Blue Intensity; SATM: Mean Saturation; LC: Luminance Contrast; RGB: Red-Green Contrast; YBC: Yellow-Blue Contrast; SATC: Saturation Contrast; TC: Texture Contrast; S: Surfaceness; C: Cornerness; E: Edgeness; BiSymm: Bilateral Symmetry; Ra-Symm L/H: Radial symmetry with high or low spatial frequency selectivity. In addition to these low-level features, interestingness ratings were collected with the help of a pointer device (see Material and Methods), the topographic distribution of this high-level feature is shown as interestingness maps (iMap: Interestingness Map). Please note that this data is not collected for the case of Pink Noise category (lowest row). In addition to click data, recorded eye-movements for these four images are also presented in the same topographic form (fMap: Fixation Map; second row in each panel, last entry). All these maps were are shown following the histogram equalization step therefore all values occur equally likely.

