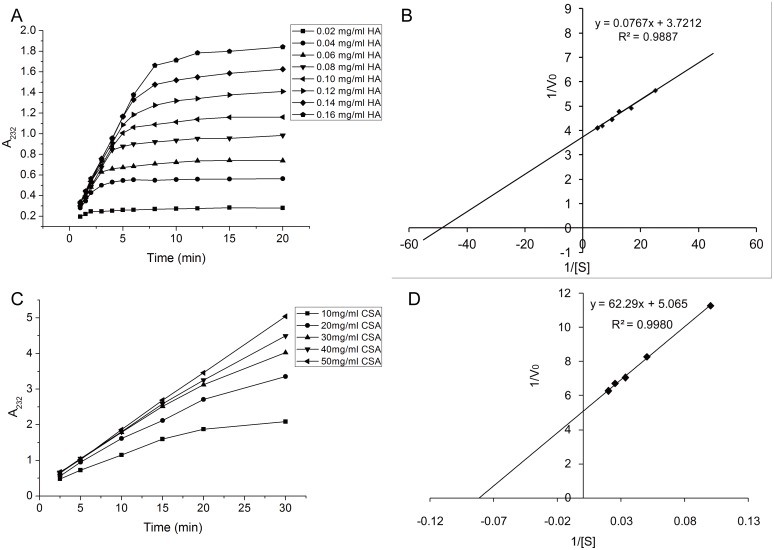
Figure 5. Enzymatic reaction kinetics of HAase-B towards HA and CSA.
(A) Time dependent kinetics of HAase-B in digesting HA substrate of various concentrations. (B) The Lineweaver–Burk double reciprocal plot showing 1/V0 versus 1/[S] (R2 = 0.9950), V0 represents initial reaction rate, and [S] represents HA substrate concentration. (C) Time dependent kinetics of HAase-B in digesting CSA substrate of various concentrations. (D) The Lineweaver–Burk double reciprocal plot showing 1/V0 versus 1/[S] (R2 = 0.9980), herein, V0 represents initial reaction rate, and [S] represents CSA substrate concentration.

