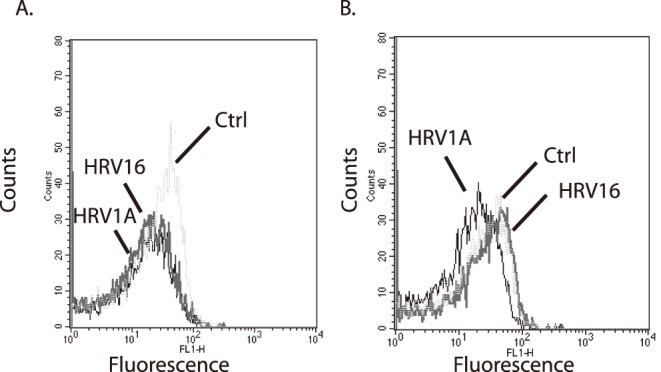
Figure 2. Measurement of mitochondrial membrane potential by monocyte-derived macrophages treated with human rhinovirus.

Primary MDMs (1×10⁶ cells/ml) were treated with either vehicle (control, dotted line), HRV 16 (MOI of 10, grey line) or HRV 1A (MOI of 10, black line) for A) 1 hr or B) 8 hrs. Rhodamine 123 was added to the cells at a final concentration of 50 µM. The fluorescence of 10,000 cells was monitored by flow cytometry. Data are representative of three independent experiments.
