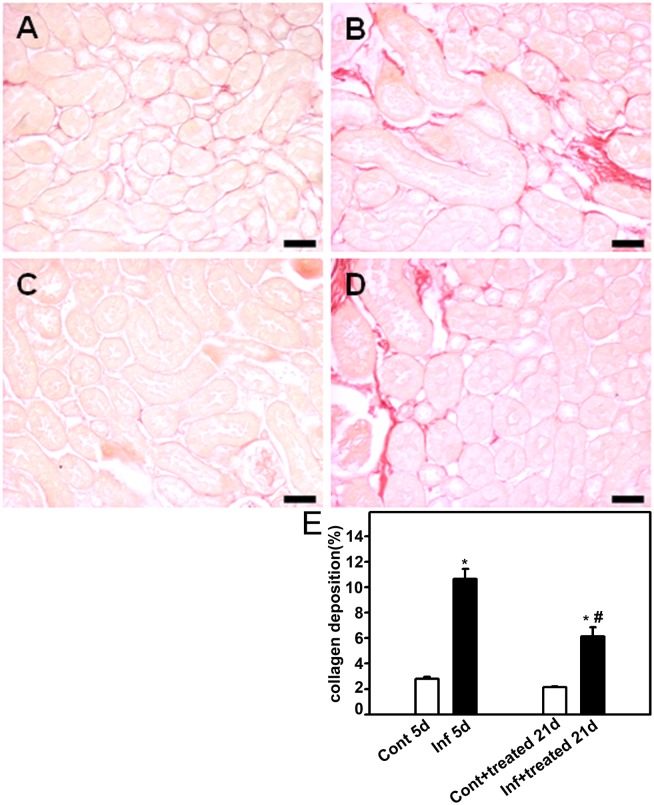
Figure 4. Effect of antimalarial treatment on collagen deposition in the renal cortex of mice.
Animals were euthanized on day 5 or 21 post infection (p.i.), perfused, and the kidneys were collected for histologic analysis. Collagen deposition in the renal cortex was visualized using Picrosirius Red stain. Representative photomicrography of noninfected mice (control5d) (A), 5 days p.i. (infected5d) (B), noninfected mice that received treatment with antimalarial drugs (control+treated21d) (C), and infected mice that received treatment with antimalarials (infected+treated21d) (D) (n = 6 per group). Bar = 20 µm. Collagen deposition is quantified in (E). Values are expressed as a percentage of collagen deposition per area (means ± standard error). *Statistically significant compared with control5d or control+treated21d. #Statistically significant compared with control5d or infected5d (P<0.05).

