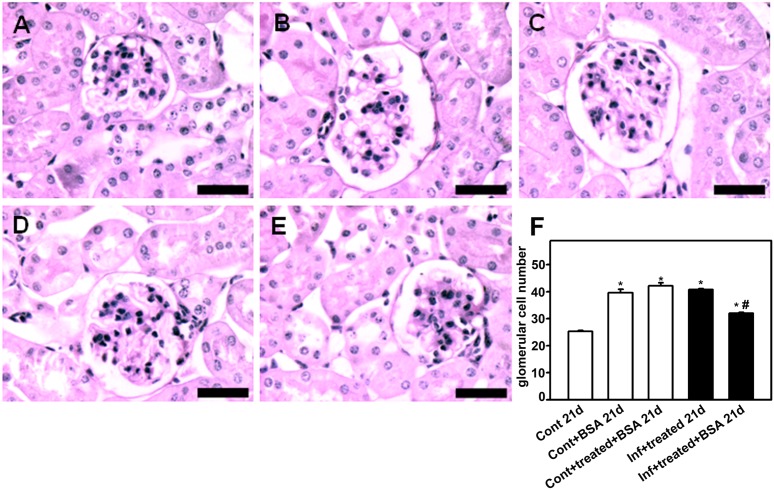
Figure 7. Glomerular cell number decreases in mice subjected to a second kidney insult.
Animals were euthanized on day 21 post infection (p.i.), perfused, and the kidneys were collected for histologic analysis. The number of glomerular cells in the renal cortex was visualized using periodic acid−Schiff. Representative photomicrographs of (A) control21d, (B) control+BSA 21d, (C) control+treated+BSA 21d, (D) infected+treated 21d, and (E) infected+treated+BSA 21d (n = 6 per group). Bar = 40 µm. The number of glomerular cells is quantified in (F). The results are expressed as means ± standard error. *Statistically significant compared with control21d. #Statistically significant compared with infected+treated 21d (P<0.05).

