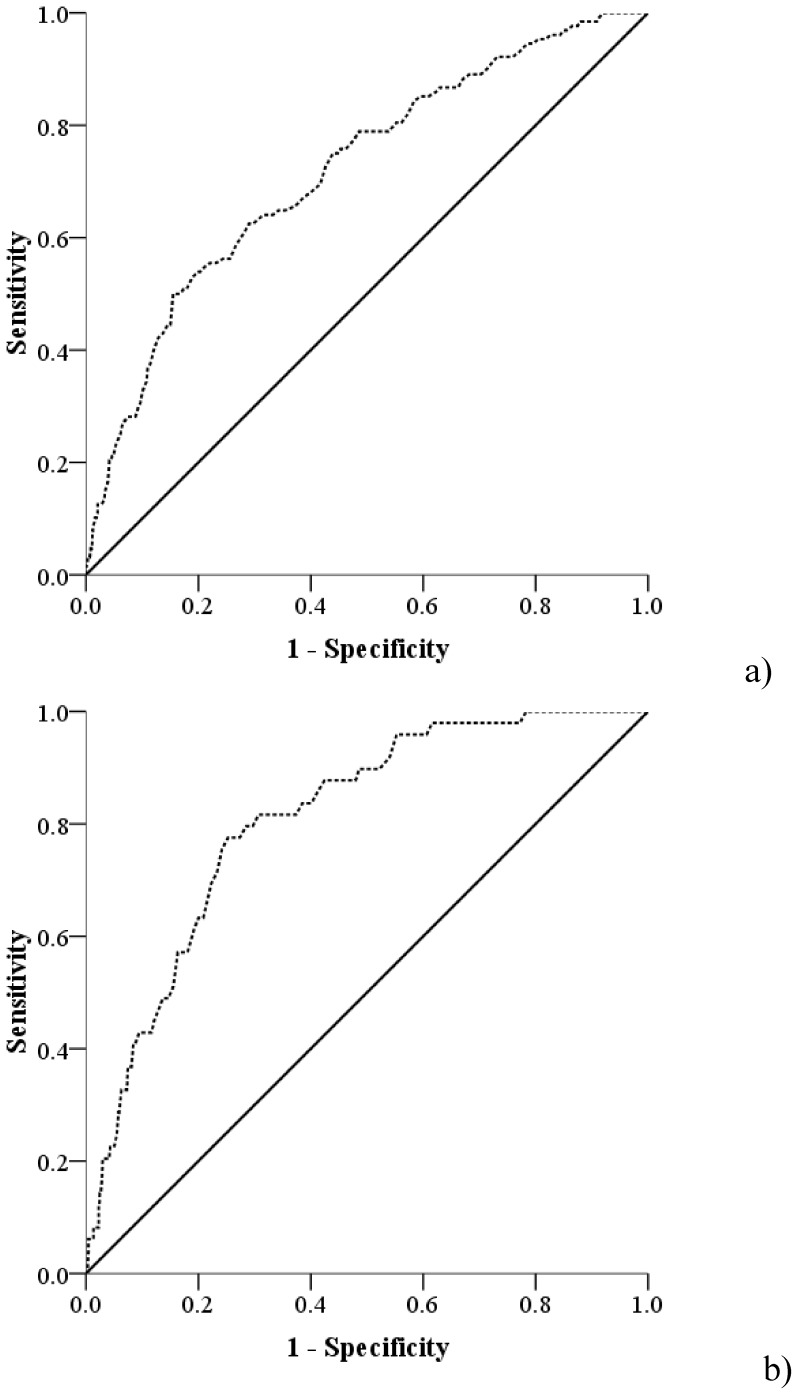
Figure 1. ROC curve for a) endoscopically visible CLE of any length independent of histology (AUC: 0.72), b) segment containing IM≥2 cm (AUC: 0.81) in the training cohort (N = 1603).
ROCs curve were developed using the risk scores which are calculated using the weights of different predictors. The weights were developed based on the coefficients of predictors in the backward logistic regression model in the training cohort.

