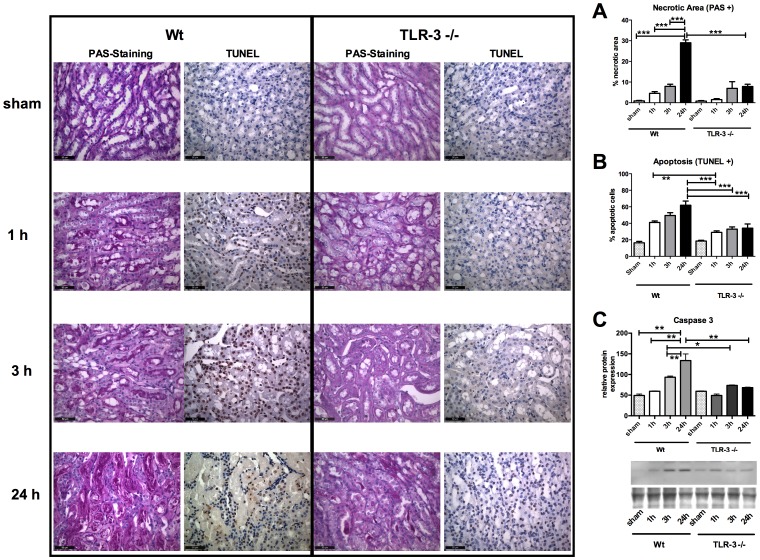
Figure 4. TLR-3 activation induces apoptosis and necrosis.
PAS (left micrographs), TUNEL (right micrographs) staining and Caspase-3 western blot analysis (C). PAS staining detects increased necrotic tissue areas in wt animals (A). TUNEL staining detects increased apoptosis in wt animals (B). Western blot analysis detects increased Caspase-3 protein expression in wt animals (C). Automatized evaluation was performed on three randomly assigned pictures from each slide (left: wt mice, right: TLR-3-/- mice; n = 6/group; calibration bar represents 50 µm). (P<0.01; ***, P<0.001).

