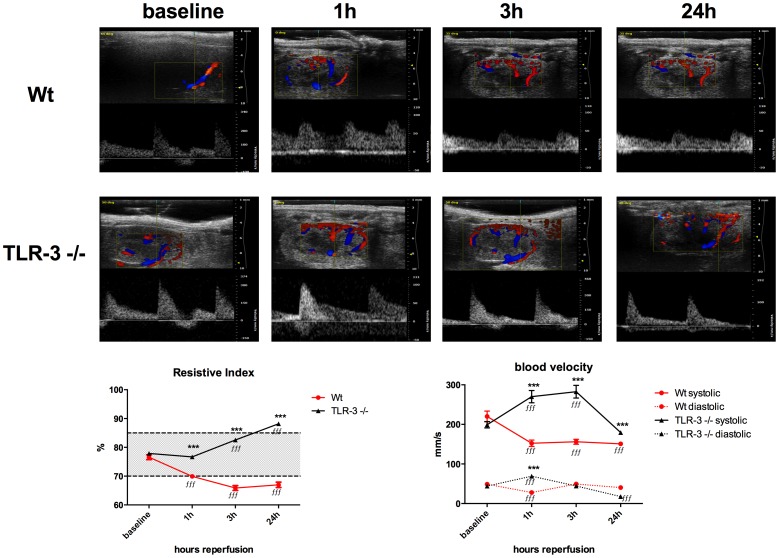
Figure 5. Color duplex sonography.
Representative doppler flow profiles before (baseline), 1, 3 and 24 h after ischemia (A). Left graph: resistive index. Dotted lines indicate upper and lower normal limits. Right graph: systolic (upper) and diastolic (lower, dotted) (B). 10 s video sequences from at least 15 flow signature were measured per animal (n = 6/group). Black line: TLR-3-/- mice, red line: wt mice. (ƒƒƒ***, P<0.001). ƒ considered statistically different from the corresponding sham and * considered different from the corresponding wt time-point.

