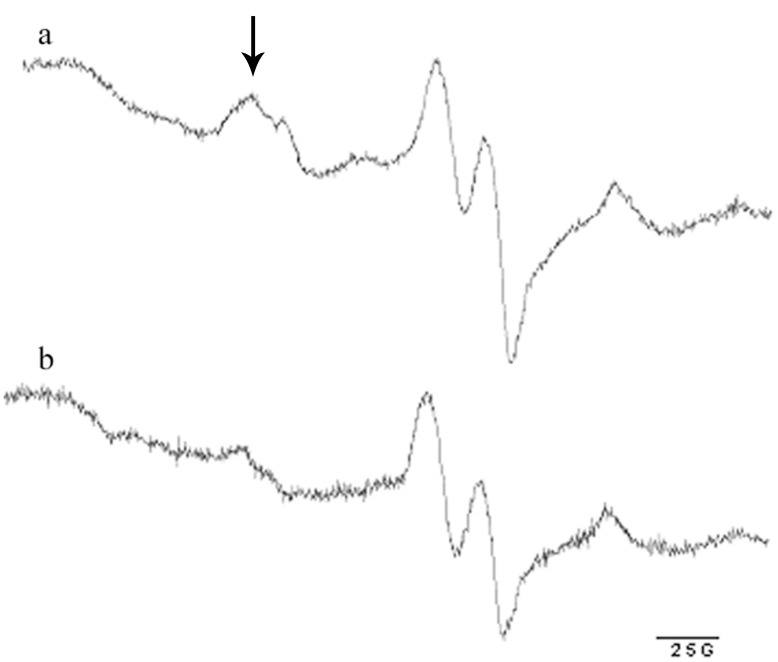
Figure 1. Representative picture of the typical EPR spectrum of sample from rat soleus muscle recorded after Fe-DETC administration.
a, a representative spectrum from soleus muscle of rat from CA group after 48 hours of L-Arg administration with drinking water; b, a representative spectrum from soleus muscle of control rat without L-Arg administration. The spectrum component used to evaluate relative NO concentration is indicated by the arrow.

