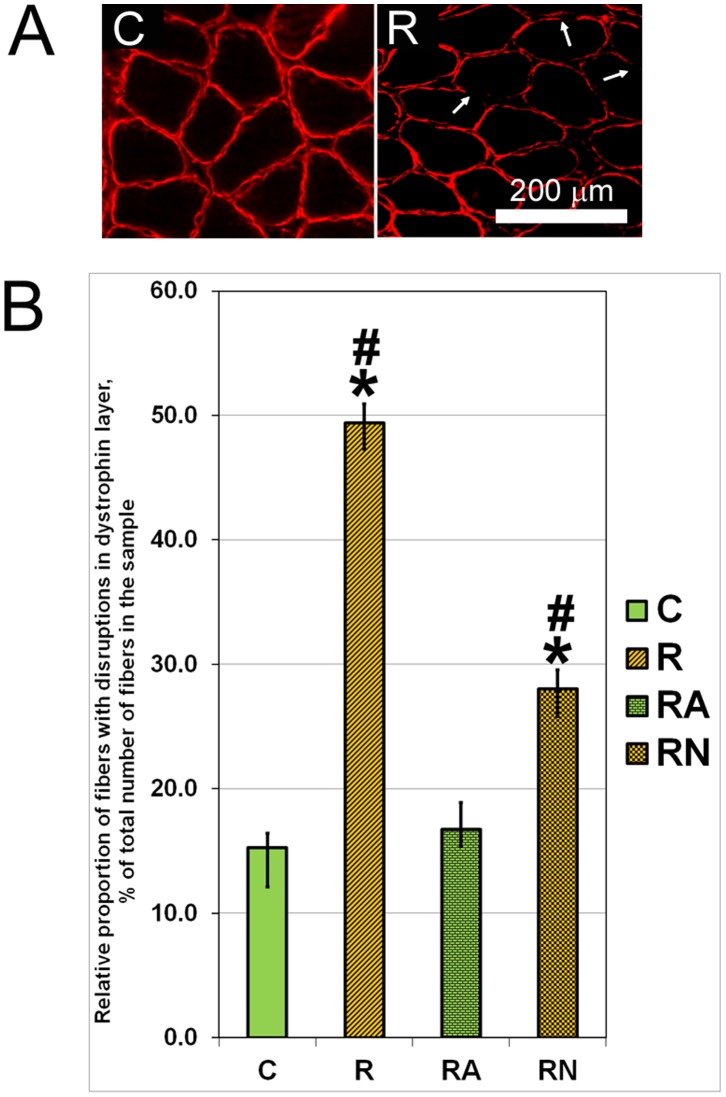
Figure 2. Representative picture of the immunostaining of samples from soleus muscles of C and R rats with antibodies against dystrophin (A) and proportion of muscle fibers with disruptions of immunostaining in the dystrophin layer (B) after normalization for the total number of fibers in each sample.
Arrows in A indicate disruptions of immunostaining in the dystrophin layer. N = 7. *indicates a significant difference from control, p<0.05; #indicates a significant difference from RA, p<0.05.

