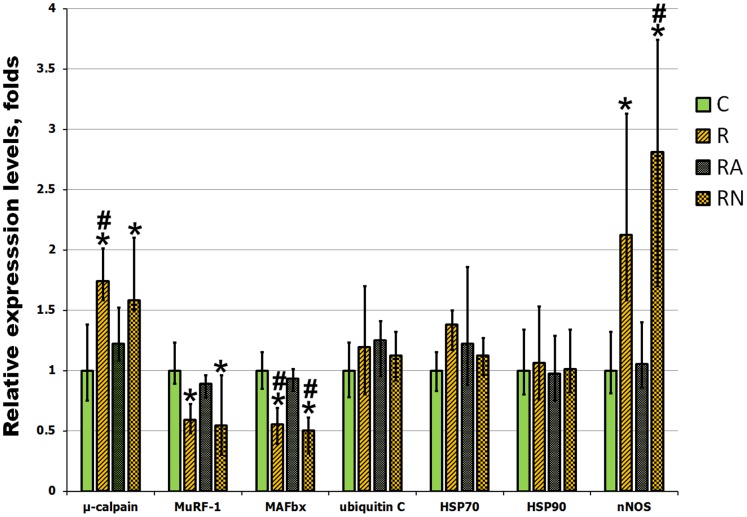
Figure 5. Evaluation of gene expression in soleus muscles of C, R, RA and RN rats.
mRNA expression of genes involved in NO generation, protein degradation and cytoprotection was evaluated by quantitative PCR analysis. N = 7. Values are normalized to the expression of β-actin in each sample. *indicates a significant difference from control, p<0.05; #indicates a significant difference from RA, p<0.05.

