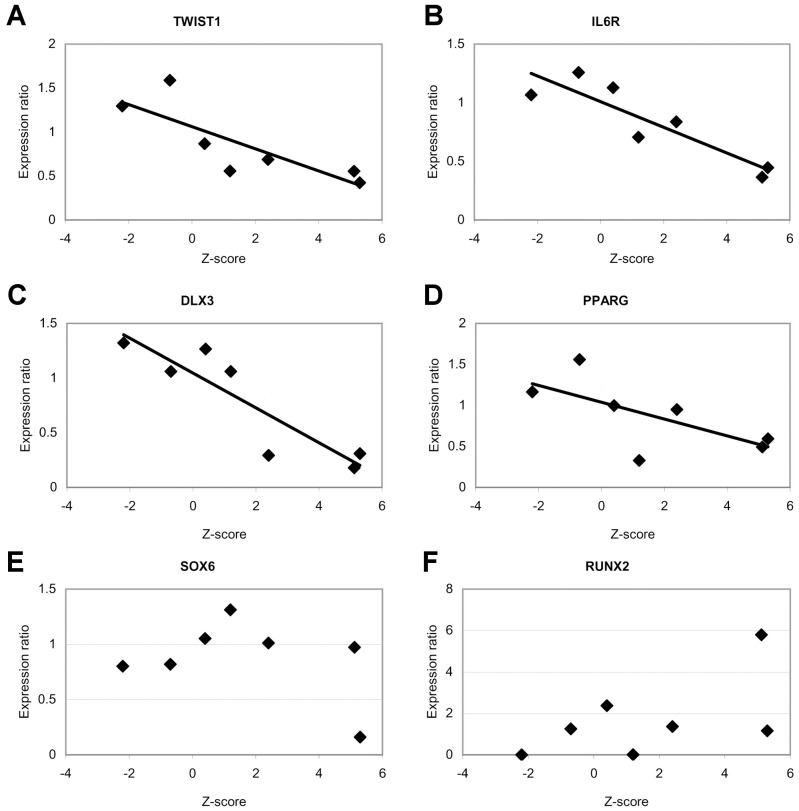
Figure 3. Analysis of mRNA levels of several candidate genes in relation to BMD levels.
(A–D) Trend of correlation between Z-score values and gene expression levels of (A) TWIST1, (B) IL6R, (C) DLX3 and (D) PPARG. (E) One of the HBM samples presented an expression level of SOX6 5-fold decreased in relation to the mean of five control individuals. (G) The other HBM sample presented an expression level of RUNX2 that was 6-fold increased.

