
Figure 2. Picked peaks of the peptide sequence “AVANQPIAVAVEGGGR” at all Time Points (TP).
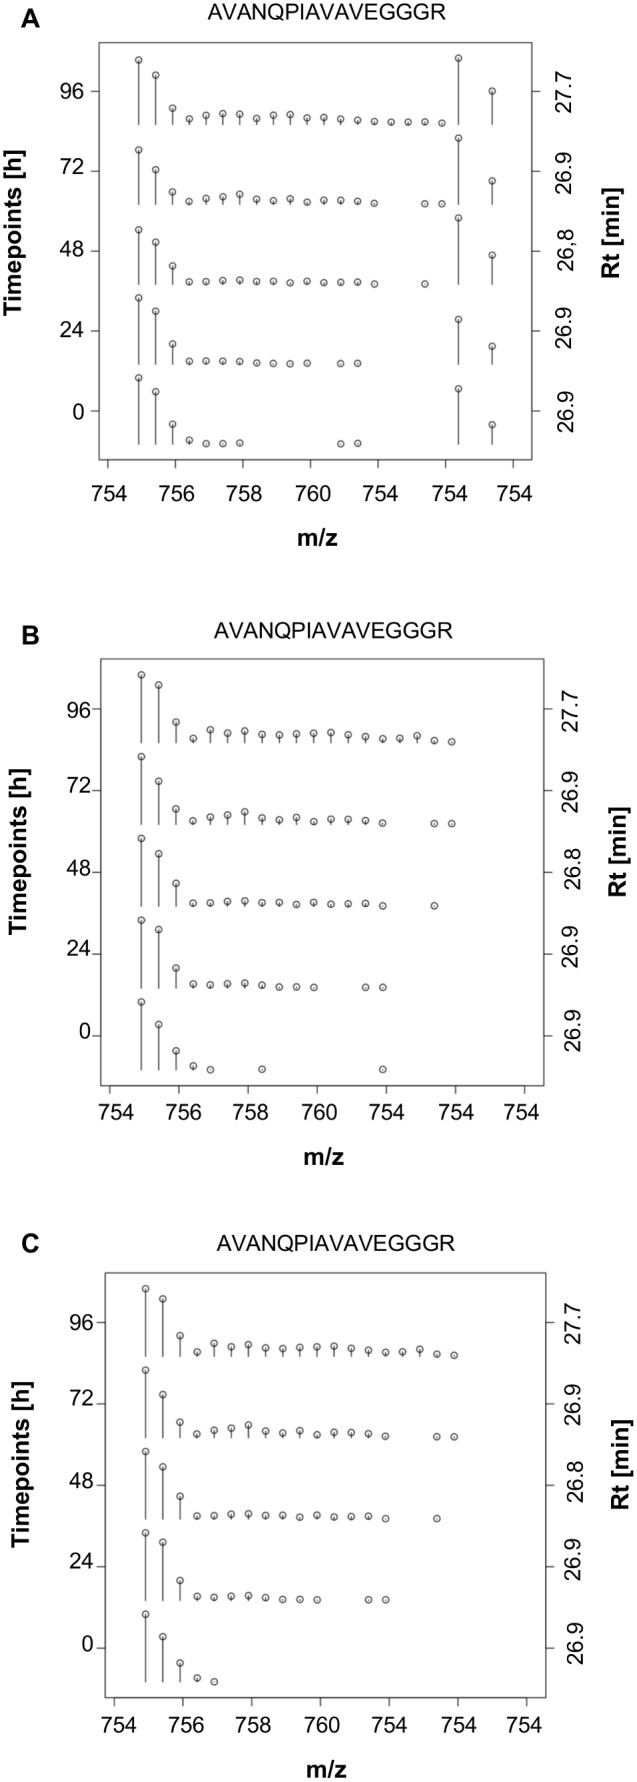
The abscissa indicates the mass to charge ratio. Left ordinate indicates Time Points (corresponding to the user-given number in the “Experiment file”), right ordinate indicates the retention time (in minutes) of the scan used to pick the peaks. The individual spectra are normalized to the base peak of the given spectrum. A: Without the application of any filters. B: Filter out co-eluted picked peaks. C: Filter out co-eluted picked peaks and Filter noise at TP0.