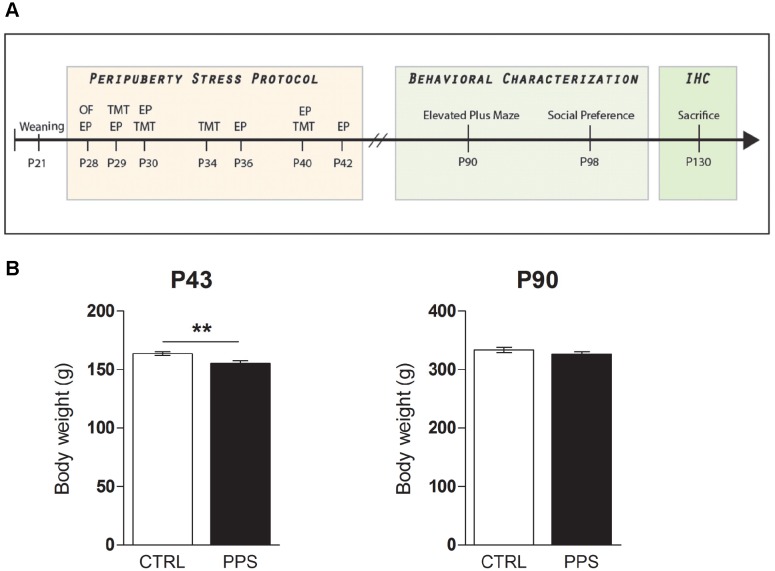
Figure 1. Experimental design and weight changes following peripuberty stress.
Experimental design (A). All animals were weaned at P21 and at P28 they were assigned randomly to either CTRL or PPS groups. The peripuberty stress protocol consisted of exposure to an open field (OF) on the first day and then to elevated platform (EP) and predator odor (TMT), stressors that were presented in a variable manner until P42. The behavioral testing started at P90. Weight measurements were taken during the early-life period and at adulthood. IHC: Immunohistochemistry. Weight changes immediately after exposure to peripuberty stress and at adulthood (B). A reduction of body weight in PPS animals is evident one day after the end of the stress protocol, at P43, while no difference was observed at P90. ** p<0.01 versus CTRL; results are the mean ± SEM.

