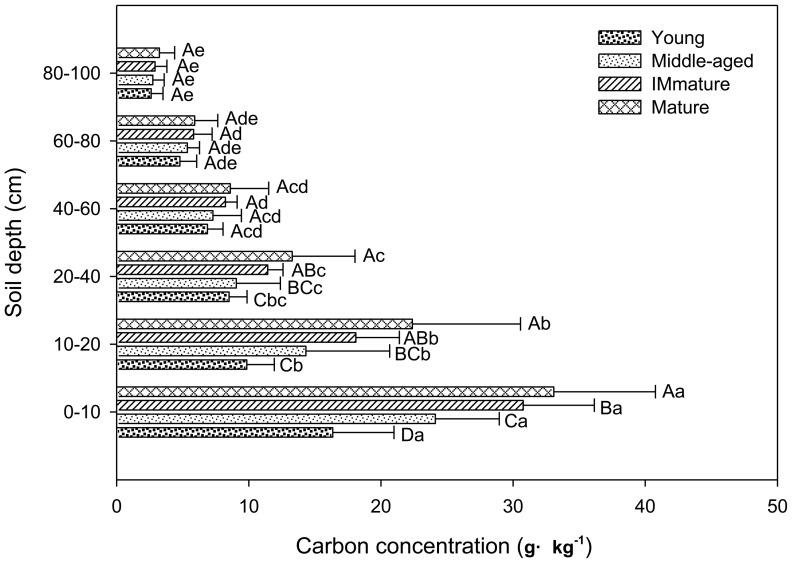
Figure 3. MSOC concentrations at different soil depths in the P. tabulaeformis forests.
Different uppercase letters indicate a significant difference between age groups in the same depth (p<0.05), different lowercase letters indicate a significant difference between different soil depths within-stand (p<0.05). Error bars standard deviation (SD).

