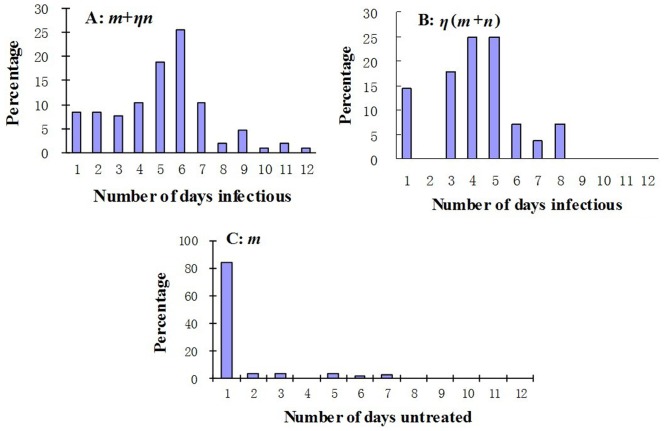
Figure 4. Infectious periods of all cases.
A, Distribution of cases provided with fractional medical intervention (m+ηn) during infectious period; B, distribution of cases provided with combined intervention (η[m+n]) during infectious period; C, distribution of part of the infectious period with no medical intervention (m).

