
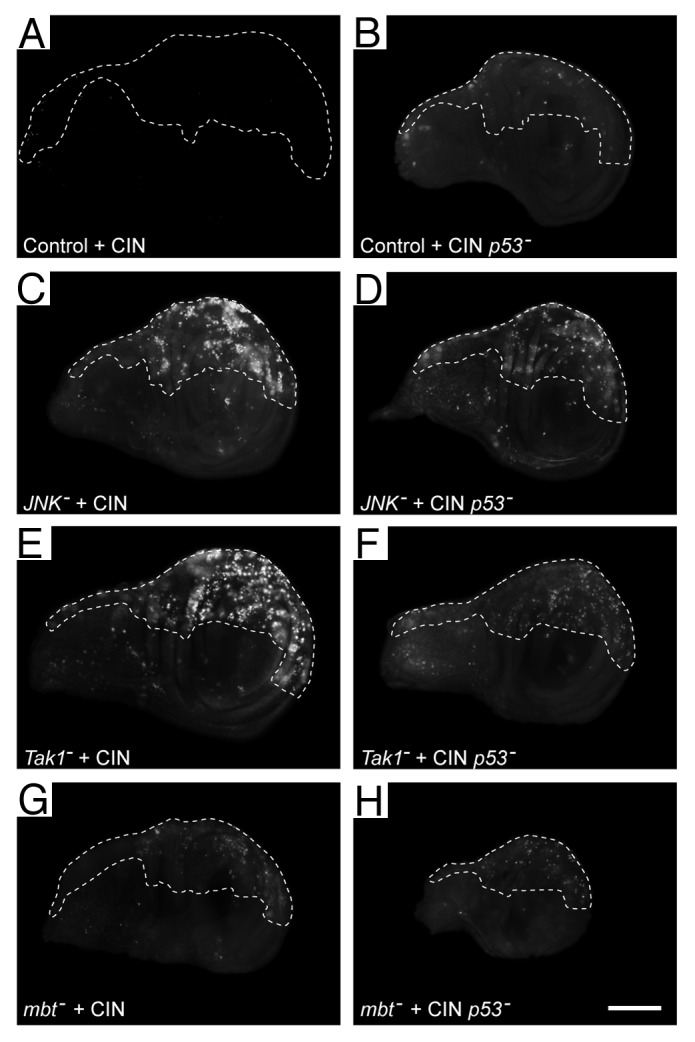
Figure 3. Some of the cell death observed when the JNK pathway is reduced in CIN cells is independent of p53. Wing discs were stained with Acridine Orange to show cell death. In every disc, the unmarked region does not express RNAi constructs, while the dashed line shows the area affected by CIN (induced by the expression of mad2-RNAi) and/or kncockdown of p53. Control wings (A and B) show little cell death when CIN is induced (A) or when p53 is knocked down in CIN cells (B). (C, E, and G) Imaginal discs in which members of the JNK signaling pathway, (JNK, Tak1, or Mbt) have been knocked down in CIN cells, giving rise to high levels of cell death. (D, F, and H) Imaginal discs showing that cell death is reduced but not eliminated by knockdown of p53 in CIN cells that are also knocked down for the indicated JNK pathway member. The scale bar shows 100 μm.