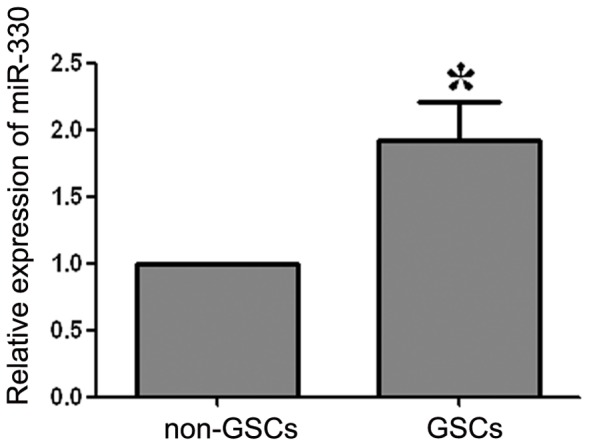
Figure 2. Expression of miR-330 in GSCs and non-GSCs.

Relative expression levels of miR-330 in GSCs and non-GSCs. The expression of miR-330 in non-GSCs accounted for 45.26% of that in GSCs. Values represent the mean ± SD from five independent experiments. *P<0.05 vs. non-GSCs group.
