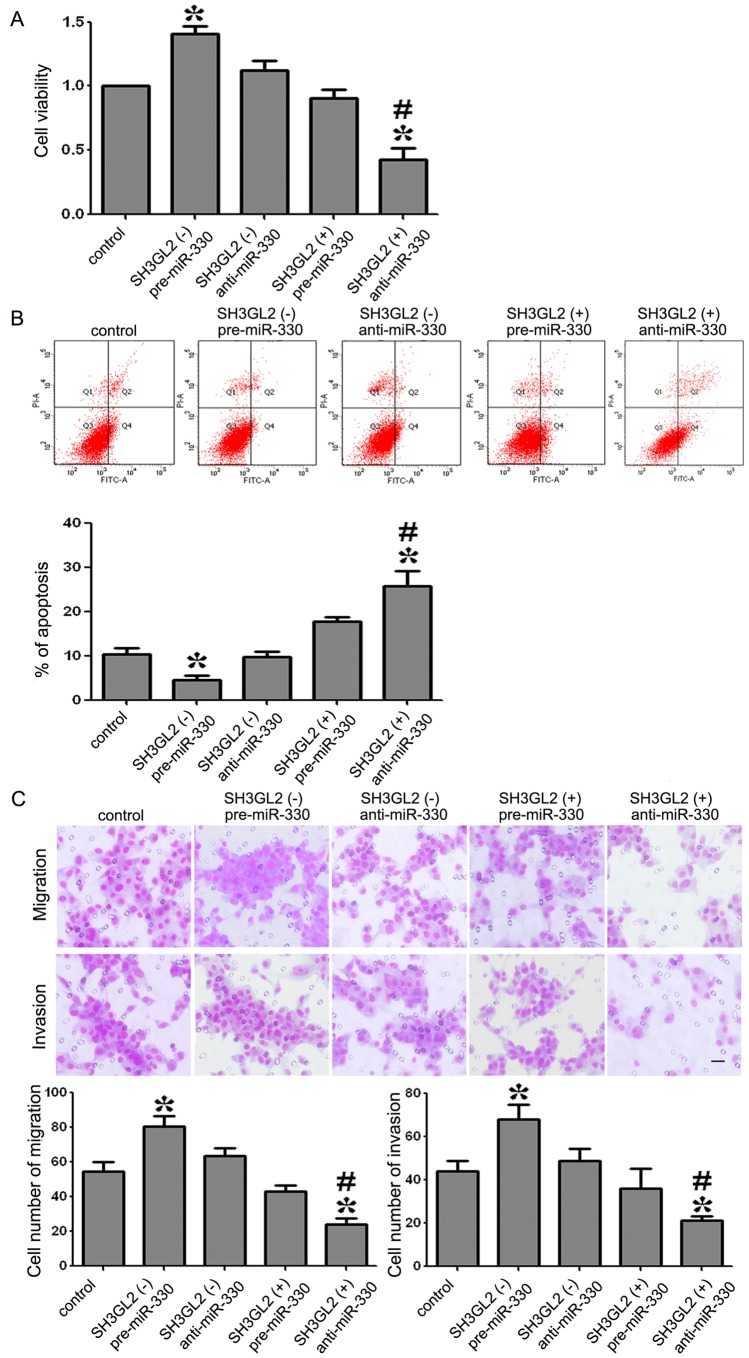
Figure 5. Proliferation, apoptosis, migration and invasion of GSCs with the expression of miR-330 and SH3GL2 changed.
(A) The ability proliferation in GSCs with the expression of miR-330 and SH3GL2 changed. (B) Incidence of apoptotic cells was studied by flow ctometry. The cells were stained with annexin V-fluorescein isothiocyanate and counterstained with PI. (C) The ability of GSCs migration and invasion with the expression of miR-330 and SH3GL2 changed. Values represent the mean ± SD from five independent experiments. *P<0.05 vs. control group, #P<0.01 vs. SH3GL2 (−) & pre-miR-330 group. Scale bars represent 20 µm.

