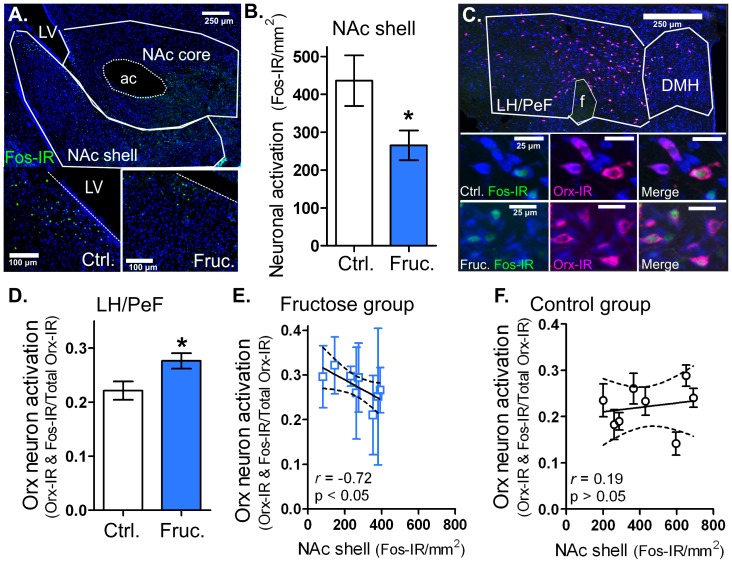
Figure 3. Long-term fructose bingeing reduced NAc shell neuron and enhanced LH/PeF Orx neuron activation.
Immunohistochemical (IHC) staining results following long-term IAM (see Fig. 2). A: Anatomic outlines of NAc shell and core with enlarged representative images of IHC staining in NAc shell from control (Ctrl.) and 8% fructose (Fruc.) group animals with Fos-IR in green and Nissl stain in blue. B: Group results for NAc shell Fos-IR. C: Anatomic outlines of LH/PeF and DMH with enlarged representative images of IHC staining in Ctrl. and Fruc. group animals. The Fos-IR nuclei are in green, Orx-IR cells are in fuchsia and Nissl stain is in blue. D: Group results for the ratio of Orx neuron activation (Fos-IR nuclei in Orx-IR cells) in the LH/PeF. E: Significant negative correlation between LH/PeF Orx neuron activation and NAc shell neuron activation in the fructose IAM group. F: No correlation in the control IAM group. Dotted bands represent 95% confidence intervals of the linear regression. Mean values ± SEM (n = 7–8 per group) *p<0.05 unpaired t-test. Abbreviations: anterior commissure (ac), lateral ventricle (LV), fornix (f).

