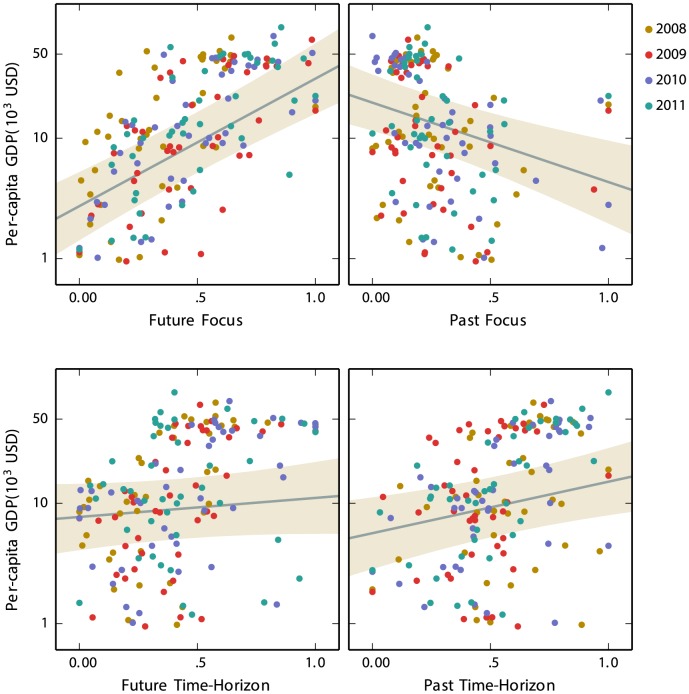
Figure 3. Per-capita GDP as a function of future and past focuses and future and past time-horizons.
The solid lines represent predictions from the mixed-effect model, and the shaded areas represent 95% confidence regions of the predictions, based on the intercept and the given fixed effect. In plotting the model prediction, the other fixed effects (e.g., the effect of past focus in the top left panel) are marginalized by mean-averaging.

