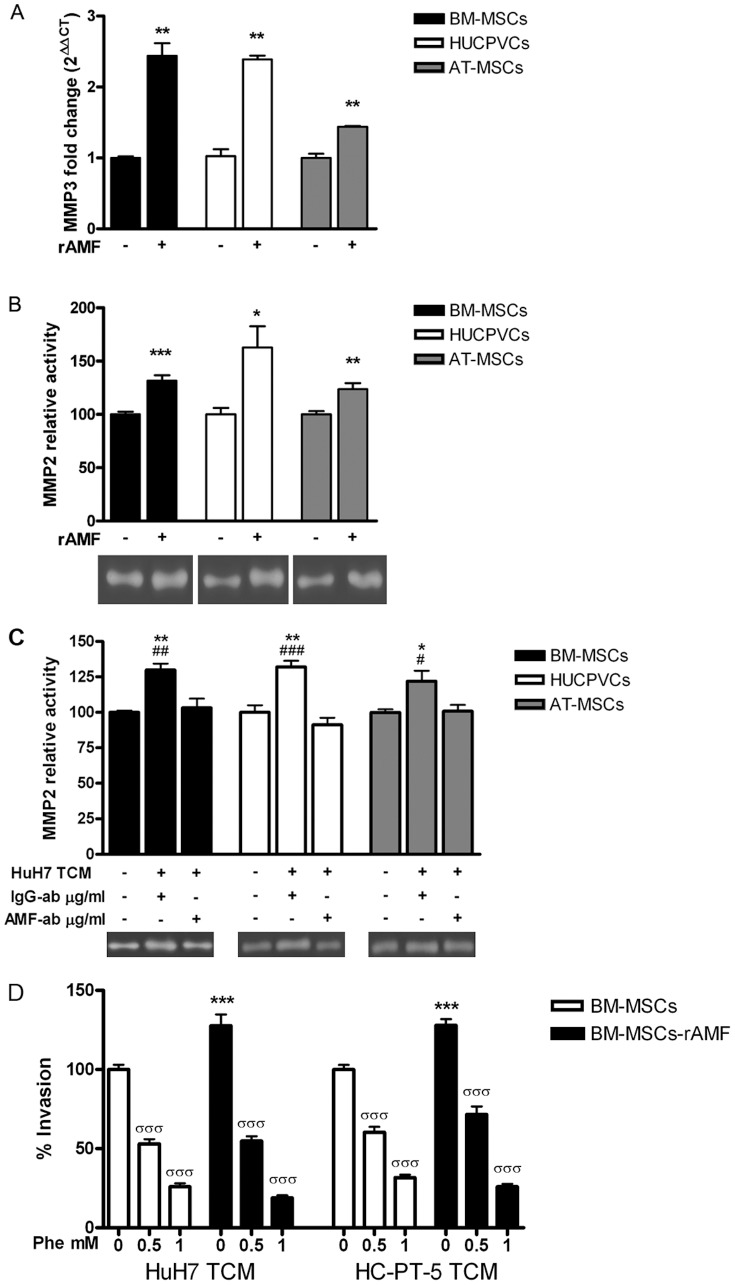
Figure 3. MMP3 expression and MMP2 activity is induced in MSCs by rAMF.
A) Analysis of MMP3 expression by qRT-PCR in BM-MSCs (black bars), HUCPVCs (white bars) or AT-MSCs (gray bars) stimulated with 1 µg/ml of rAMF. **p<0.01 vs unstimulated cells (DMEM, unpaired Student's t test). B) MMP2 activity was evaluated by zymography in supernatants of BM-MSCs (black bars), HUCPVCs (white bars) or AT-MSCs (gray bars) pre-stimulated with 1 µg/ml of rAMF. Band intensity of 3 independent experiments was detected by densitometric evaluation and plotted as MMP2 relative activity. *p<0.05, **p<0.01 and ***p<0.001 vs untreated cells (DMEM, ANOVA and Tukey's comparison test). One representative image of the zymography is shown. C) MMP2 activity was evaluated by zymography in MSCs (BM-MSCs, black bars; HUCPVCs, white bars; and AT-MSCs, gray bars) culture supernatant stimulated with TCM from HuH7 cells. TCM from HuH7 cells was blocked with anti-AMF antibody (AMF-ab) or isotype control (IgG-ab). Band intensity of 3 independent experiments was detected by densitometric evaluation and plotted as MMP2 relative activity. One representative image of the zymography is shown. *p<0.05 and **p<0.01 vs DMEM (ANOVA); #p<0.05, ##p<0.01 and ###p<0.001 vs AMF-blocked TCM from HuH7 (HuH7 TCM+/AMF-ab+, ANOVA and Tukey's comparison test). D) Invasion capacity of BM-MSCs (white bars) or stimulated with rAMF (black bars) to type IV collagen using TCM from HuH7 or HC-PT-5 preincubated with different doses of the MMP inhibitor 1,10 phenantroline (Phe). ***p<0.001 vs without stimulation with rAMF and σσσp<0.001 vs without preincubation with Phe (ANOVA). Results are representative of 3 independent experiments.

