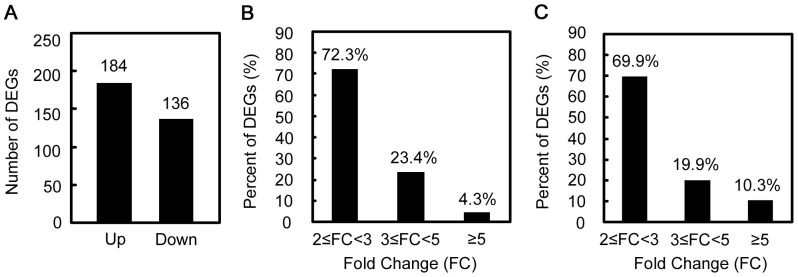
Figure 3. Analysis of differentially expressed genes (DEGs) response to ASGV infection.

(A) Numbers of DEGs. (B) and (C) Distribution of fold changes (FC) for up-regulated and down-regulated DEGs, respectively.

(A) Numbers of DEGs. (B) and (C) Distribution of fold changes (FC) for up-regulated and down-regulated DEGs, respectively.