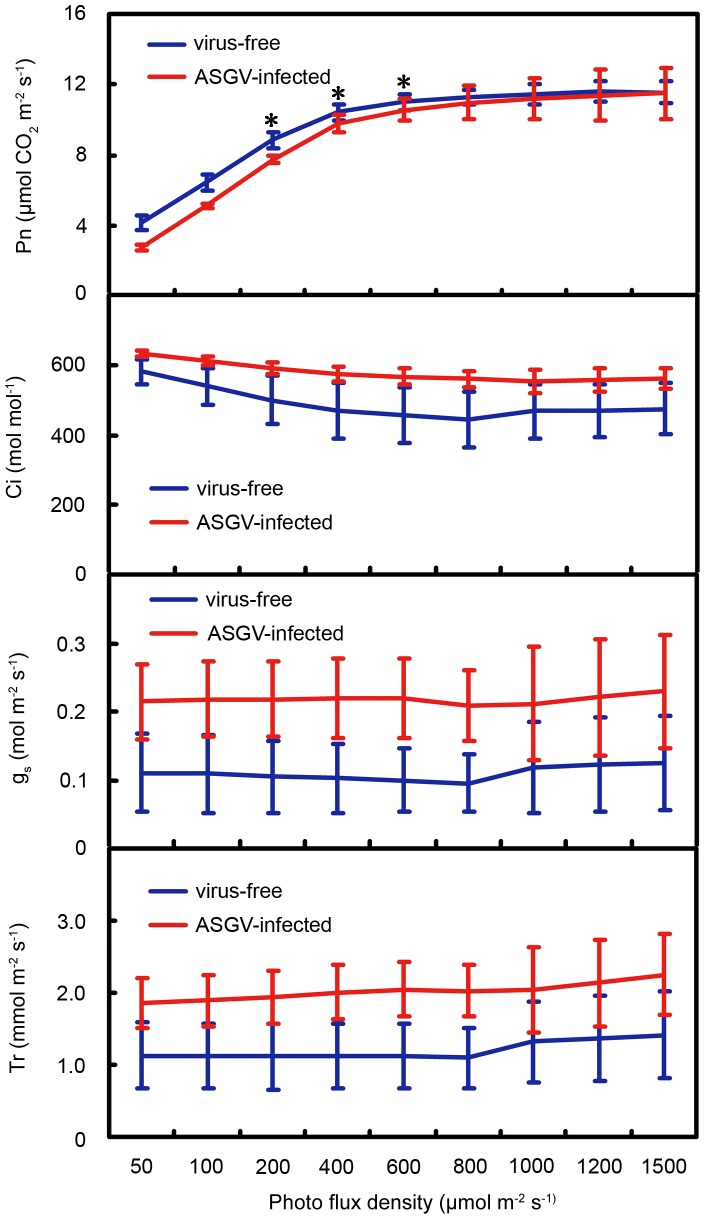
Figure 6. Comparison of photosynthesis between virus-free and ASGV-infected apple shoots.
(A) Light response curves (net photosynthesis, Pn). (B) Intercellular CO2 concentration (Ci). (C) Stomatal conductance (gs). (D) Transpiration rate (Tr). Data represent means and standard errors based on measurements from six biological replicates. Asterisks indicate significant differences (P<0.05) between ASGV-infected and virus-free shoots under specific photo flux densities.

