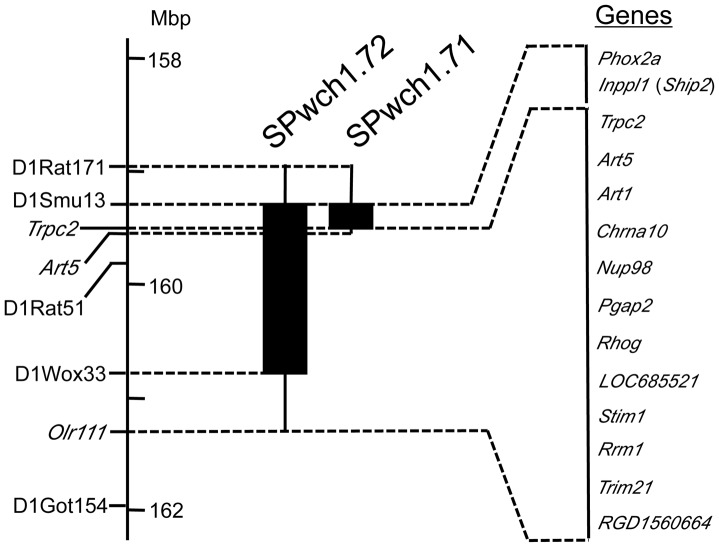
Figure 1. Genetic map of the congenic region and candidate genes located in the region.
Closed columns indicate the regions transferred from the WKY genome. Vertical lines on the both ends of the columns show intervals including recombination breakpoints. Supplementary Table S3 is available for further information about the candidate genes. Genomic position of each simple sequence repeat marker and SNPs in the Trpc2, Art5 and Olr111 are defined based on RGSC Genome Assembly v3.4.

