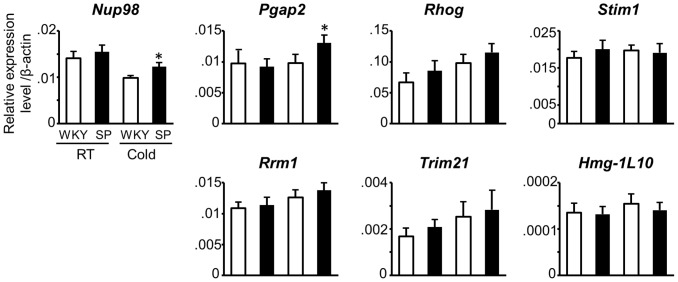
Figure 2. Expression analysis of candidate genes in the brainstem of WKY and SHRSP.
Five rats of the each strain were used. Ventrolateral part of the brainstem including RVLM was dissected and RNA was extracted. Relative levels of gene expression were evaluated by quantitative RT-PCR analysis. The expression levels of each gene were normalized with β-actin mRNA. Each column shows the expression level of WKY and SHRSP under the room temperature (RT) or under the cold stress (Cold) as indicated in the panel for Nup98. SP: SHRSP, *P<0.05 vs. WKY under the cold stress by Student’s t-test.

